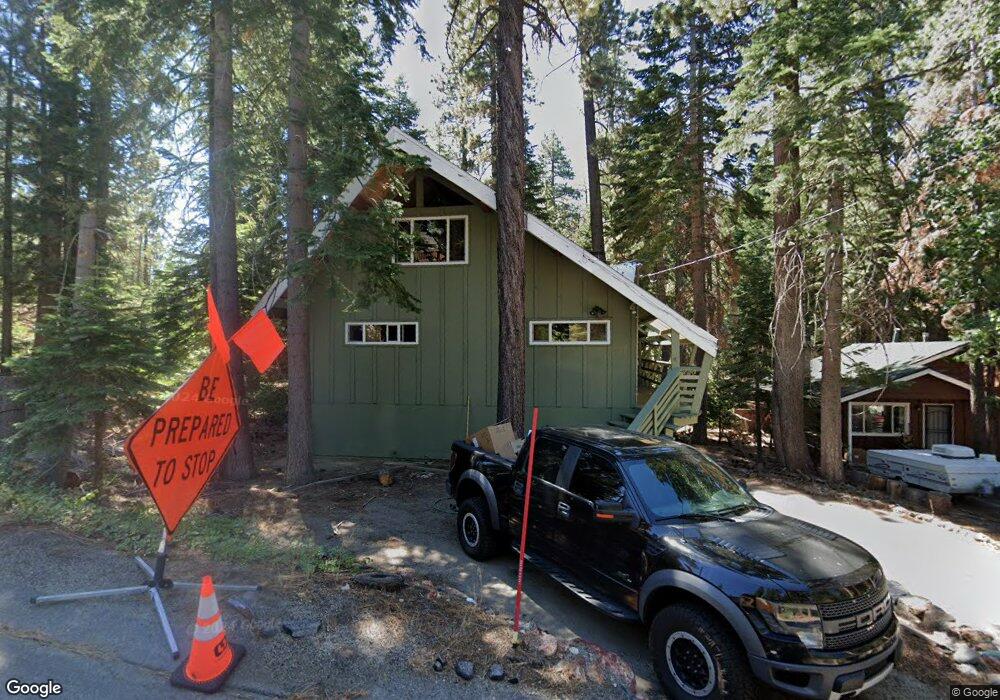
722 Gardner St South Lake Tahoe, CA 96150
Estimated Value: $639,000 - $895,000
4
Beds
4
Baths
2,600
Sq Ft
$287/Sq Ft
Est. Value
About This Home
This home is located at 722 Gardner St, South Lake Tahoe, CA 96150 and is currently estimated at $747,206, approximately $287 per square foot. 722 Gardner St is a home located in El Dorado County with nearby schools including Tahoe Valley Elementary School, South Tahoe Middle School, and South Tahoe High School.
Ownership History
Date
Name
Owned For
Owner Type
Purchase Details
Closed on
Aug 13, 2021
Sold by
Martin Christopher S
Bought by
Cairns Austin and Sawicki Nicolette
Current Estimated Value
Home Financials for this Owner
Home Financials are based on the most recent Mortgage that was taken out on this home.
Original Mortgage
$598,000
Outstanding Balance
$542,120
Interest Rate
2.7%
Mortgage Type
New Conventional
Estimated Equity
$205,086
Purchase Details
Closed on
Apr 26, 2010
Sold by
Major Paul J and Major Nina L
Bought by
Martin Christopher S
Home Financials for this Owner
Home Financials are based on the most recent Mortgage that was taken out on this home.
Original Mortgage
$312,000
Interest Rate
5.04%
Mortgage Type
New Conventional
Purchase Details
Closed on
Mar 3, 2009
Sold by
Major Nina Lee
Bought by
Major Paul J and Major Nina L
Create a Home Valuation Report for This Property
The Home Valuation Report is an in-depth analysis detailing your home's value as well as a comparison with similar homes in the area
Home Values in the Area
Average Home Value in this Area
Purchase History
| Date | Buyer | Sale Price | Title Company |
|---|---|---|---|
| Cairns Austin | $650,000 | Old Republic Title Company | |
| Martin Christopher S | -- | Old Republic Title Company | |
| Martin Christopher S | $390,000 | Old Republic Title Company | |
| Major Paul J | -- | None Available | |
| Major Nina Lee | -- | None Available |
Source: Public Records
Mortgage History
| Date | Status | Borrower | Loan Amount |
|---|---|---|---|
| Open | Cairns Austin | $598,000 | |
| Previous Owner | Martin Christopher S | $312,000 |
Source: Public Records
Tax History Compared to Growth
Tax History
| Year | Tax Paid | Tax Assessment Tax Assessment Total Assessment is a certain percentage of the fair market value that is determined by local assessors to be the total taxable value of land and additions on the property. | Land | Improvement |
|---|---|---|---|---|
| 2025 | $7,254 | $689,784 | $169,793 | $519,991 |
| 2024 | $7,254 | $676,260 | $166,464 | $509,796 |
| 2023 | $7,128 | $663,000 | $163,200 | $499,800 |
| 2022 | $7,058 | $650,000 | $160,000 | $490,000 |
| 2021 | $5,097 | $468,244 | $131,167 | $337,077 |
| 2020 | $5,093 | $466,797 | $129,823 | $336,974 |
| 2019 | $5,081 | $458,781 | $127,278 | $331,503 |
| 2018 | $4,958 | $448,926 | $124,783 | $324,143 |
| 2017 | $4,882 | $440,252 | $122,337 | $317,915 |
| 2016 | $4,784 | $431,748 | $119,939 | $311,809 |
| 2015 | $4,543 | $425,363 | $118,139 | $307,224 |
| 2014 | $4,543 | $417,161 | $115,826 | $301,335 |
Source: Public Records
Map
Nearby Homes
- 1761 13th St
- 753 Taylor Way
- 603 Gardner St
- 760 Clement St
- 1890 10th St
- 867 Clement St
- 921 Gardner St
- 1080 Julie Ln Unit 255
- 1080 Julie Ln Unit 186
- 1080 Julie Ln Unit 79
- 1080 Julie Ln Unit 82
- 1080 Julie Ln Unit 140
- 1080 Julie Ln Unit 68
- 1080 Julie Ln Unit 183
- 1080 Julie Ln Unit 16
- 1080 Julie Ln Unit 120
- 1080 Julie Ln Unit 136
- 1080 Julie Ln Unit 137
- 1080 Julie Ln Unit 199
- 1080 Julie Ln Unit 67