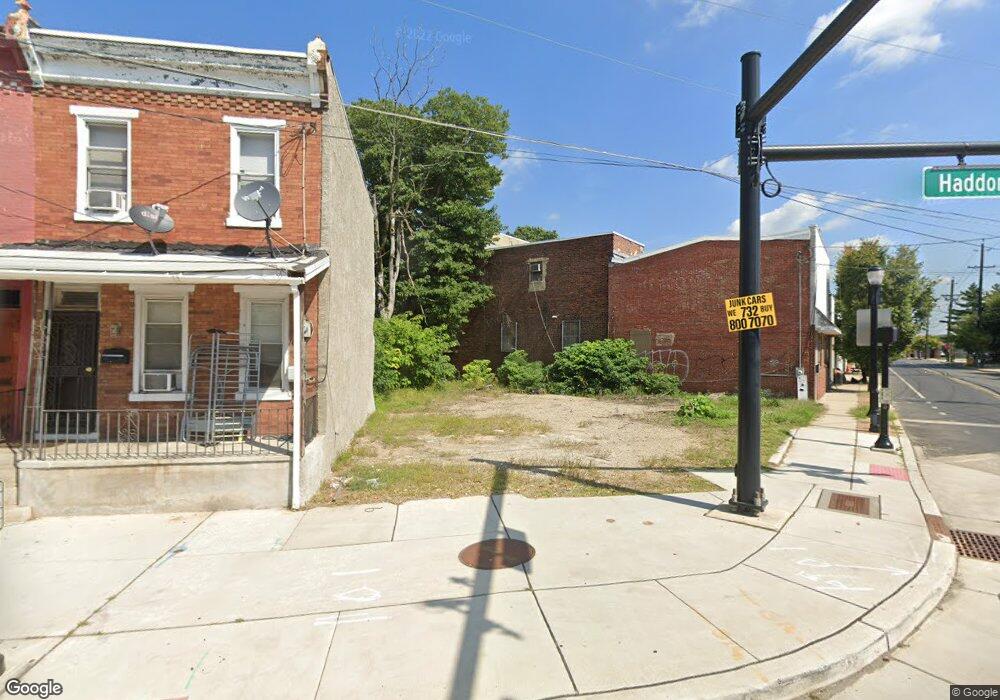
722 Haddon Ave Camden, NJ 08103
Gateway NeighborhoodEstimated Value: $104,895
3
Beds
2
Baths
1,056
Sq Ft
$99/Sq Ft
Est. Value
About This Home
This home is located at 722 Haddon Ave, Camden, NJ 08103 and is currently estimated at $104,895, approximately $99 per square foot. 722 Haddon Ave is a home located in Camden County with nearby schools including Forest Hill Elementary School, Camden High School, and Freedom Prep Charter School.
Ownership History
Date
Name
Owned For
Owner Type
Purchase Details
Closed on
Nov 28, 2008
Sold by
Barnett Joseph
Bought by
Frg Investments Llc
Current Estimated Value
Purchase Details
Closed on
May 19, 2004
Sold by
Citifinancial Mtg Co Inc
Bought by
Barnett Joseph
Purchase Details
Closed on
Mar 15, 2000
Sold by
Kearney Russell
Bought by
Snead George H
Home Financials for this Owner
Home Financials are based on the most recent Mortgage that was taken out on this home.
Original Mortgage
$20,474
Interest Rate
8.3%
Create a Home Valuation Report for This Property
The Home Valuation Report is an in-depth analysis detailing your home's value as well as a comparison with similar homes in the area
Home Values in the Area
Average Home Value in this Area
Purchase History
| Date | Buyer | Sale Price | Title Company |
|---|---|---|---|
| Frg Investments Llc | $58,000 | -- | |
| Barnett Joseph | $19,900 | -- | |
| Snead George H | $19,100 | -- |
Source: Public Records
Mortgage History
| Date | Status | Borrower | Loan Amount |
|---|---|---|---|
| Previous Owner | Snead George H | $20,474 |
Source: Public Records
Tax History Compared to Growth
Tax History
| Year | Tax Paid | Tax Assessment Tax Assessment Total Assessment is a certain percentage of the fair market value that is determined by local assessors to be the total taxable value of land and additions on the property. | Land | Improvement |
|---|---|---|---|---|
| 2025 | $204 | $5,400 | $5,400 | -- |
| 2024 | $196 | $5,400 | $5,400 | $0 |
| 2023 | $196 | $5,400 | $5,400 | $0 |
| 2022 | $181 | $5,400 | $5,400 | $0 |
| 2021 | $109 | $5,400 | $5,400 | $0 |
| 2020 | $172 | $5,400 | $5,400 | $0 |
| 2019 | $390 | $12,800 | $5,400 | $7,400 |
| 2018 | $388 | $12,800 | $5,400 | $7,400 |
| 2017 | $378 | $12,800 | $5,400 | $7,400 |
| 2016 | $366 | $12,800 | $5,400 | $7,400 |
| 2015 | $353 | $12,800 | $5,400 | $7,400 |
| 2014 | $344 | $12,800 | $5,400 | $7,400 |
Source: Public Records
Map
Nearby Homes
- 918 Mount Ephraim Ave
- 715 S 8th St
- 746 Pine St
- 917 S 8th St
- 803 Princeton Ave
- 724 Spruce St
- 718 Spruce St
- 711 Berkley St
- 1003 Langham Ave
- 700 New St Unit 308
- 764 Mount Vernon St
- 1036 Princess Ave
- 1137 Sycamore St
- 1224 Chestnut St
- 601 Berkley St
- 1140 Kaighn Ave
- 1113 Empire Ave
- 1118 Langham Ave
- 1138 Langham Ave
- 936 Mechanic St