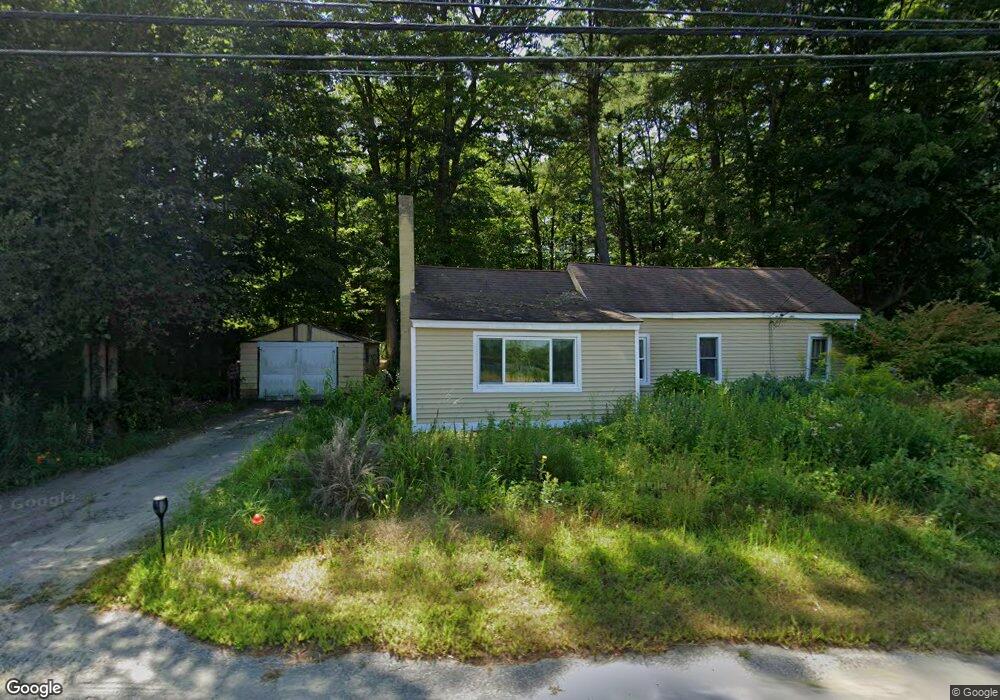
722 S Main St Orange, MA 01364
Estimated Value: $269,000 - $368,000
2
Beds
1
Bath
1,280
Sq Ft
$234/Sq Ft
Est. Value
About This Home
This home is located at 722 S Main St, Orange, MA 01364 and is currently estimated at $299,936, approximately $234 per square foot. 722 S Main St is a home located in Franklin County with nearby schools including Fisher Hill and Ralph C Mahar Regional School.
Ownership History
Date
Name
Owned For
Owner Type
Purchase Details
Closed on
Oct 22, 1993
Sold by
Stewart Charles H and Stewart Jeanne L
Bought by
Winske Paul T and Crumb Charlene E M
Current Estimated Value
Home Financials for this Owner
Home Financials are based on the most recent Mortgage that was taken out on this home.
Original Mortgage
$65,096
Interest Rate
6.73%
Mortgage Type
Purchase Money Mortgage
Create a Home Valuation Report for This Property
The Home Valuation Report is an in-depth analysis detailing your home's value as well as a comparison with similar homes in the area
Home Values in the Area
Average Home Value in this Area
Purchase History
| Date | Buyer | Sale Price | Title Company |
|---|---|---|---|
| Winske Paul T | $65,000 | -- |
Source: Public Records
Mortgage History
| Date | Status | Borrower | Loan Amount |
|---|---|---|---|
| Closed | Winske Paul T | $65,096 |
Source: Public Records
Tax History
| Year | Tax Paid | Tax Assessment Tax Assessment Total Assessment is a certain percentage of the fair market value that is determined by local assessors to be the total taxable value of land and additions on the property. | Land | Improvement |
|---|---|---|---|---|
| 2025 | $34 | $206,200 | $34,300 | $171,900 |
| 2024 | $3,038 | $174,200 | $34,300 | $139,900 |
| 2023 | $2,723 | $151,600 | $34,300 | $117,300 |
| 2022 | $2,644 | $138,300 | $34,300 | $104,000 |
| 2021 | $2,472 | $123,300 | $50,900 | $72,400 |
| 2020 | $2,444 | $120,200 | $50,400 | $69,800 |
| 2019 | $2,367 | $105,100 | $44,000 | $61,100 |
| 2018 | $2,198 | $100,200 | $40,900 | $59,300 |
| 2017 | $2,127 | $100,200 | $40,900 | $59,300 |
| 2016 | $2,148 | $99,000 | $40,900 | $58,100 |
| 2015 | $2,042 | $98,300 | $40,900 | $57,400 |
| 2014 | $1,942 | $98,400 | $40,900 | $57,500 |
Source: Public Records
Map
Nearby Homes
- 726 S Main St
- 746 S Main St
- 53 Magoon Rd
- 702 S Main St
- 756 S Main St
- 745 S Main St
- 117 Magoon Rd
- 760 S Main St
- 56 Magoon Rd
- 708 S Main St
- 265 Daniel Shays Hwy
- 300 Daniel Shays Hwy
- 10 Old South Rd
- 287 Daniel Shays Hwy
- 186 Magoon Rd
- 295 Daniel Shays Hwy
- 195 Magoon Rd
- 195A Magoon Rd
- 297 Daniel Shays Hwy
- 22 Old South Rd
Your Personal Tour Guide
Ask me questions while you tour the home.