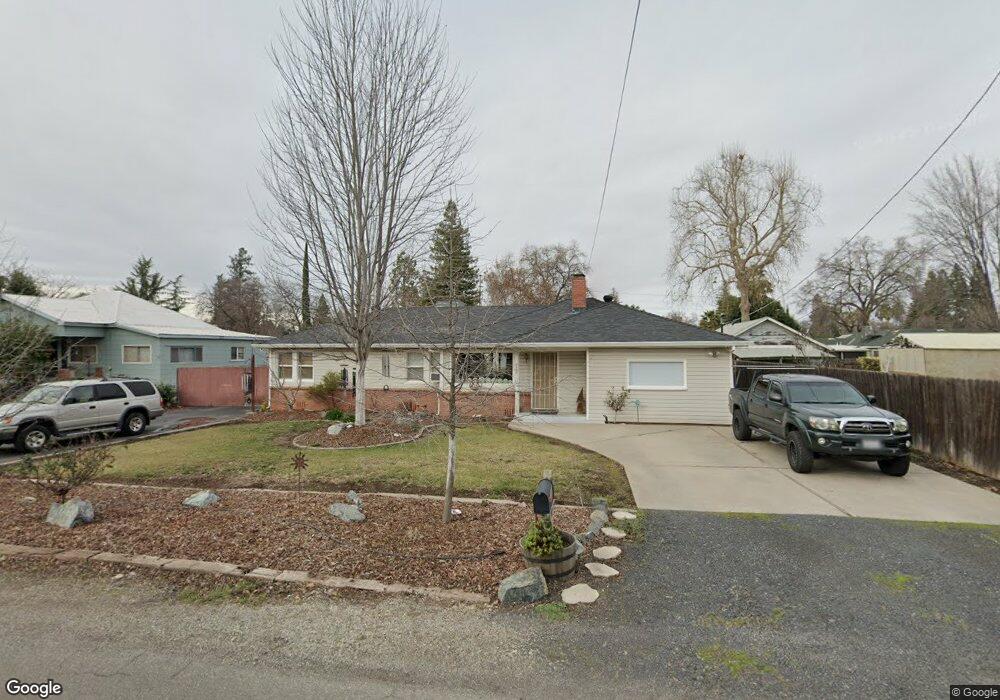
722 Sequoyah Ave Chico, CA 95926
Chico Vecino NeighborhoodEstimated Value: $354,000 - $431,000
3
Beds
2
Baths
1,566
Sq Ft
$258/Sq Ft
Est. Value
About This Home
This home is located at 722 Sequoyah Ave, Chico, CA 95926 and is currently estimated at $403,617, approximately $257 per square foot. 722 Sequoyah Ave is a home located in Butte County with nearby schools including Citrus Avenue Elementary School, Chico Junior High School, and Chico High School.
Ownership History
Date
Name
Owned For
Owner Type
Purchase Details
Closed on
Oct 16, 2024
Sold by
Cherrington Matthew J and Cherrington Rebecca L
Bought by
Matthew And Rebecca Cherrington Living Trust and Cherrington
Current Estimated Value
Purchase Details
Closed on
Mar 5, 2009
Sold by
Cherrington Matthew J and Cherrington Rebecca L
Bought by
Cherrington Rebecca L and Cherrington Matthew J
Home Financials for this Owner
Home Financials are based on the most recent Mortgage that was taken out on this home.
Original Mortgage
$50,000
Interest Rate
5.03%
Mortgage Type
Credit Line Revolving
Purchase Details
Closed on
Apr 28, 1999
Sold by
Mace Marjorie J
Bought by
Cherrington Matthew J and Cherrington Rebecca L
Home Financials for this Owner
Home Financials are based on the most recent Mortgage that was taken out on this home.
Original Mortgage
$67,500
Interest Rate
6.98%
Create a Home Valuation Report for This Property
The Home Valuation Report is an in-depth analysis detailing your home's value as well as a comparison with similar homes in the area
Home Values in the Area
Average Home Value in this Area
Purchase History
| Date | Buyer | Sale Price | Title Company |
|---|---|---|---|
| Matthew And Rebecca Cherrington Living Trust | -- | None Listed On Document | |
| Cherrington Rebecca L | -- | Mid Valley Title & Escrow Co | |
| Cherrington Matthew J | $90,000 | Fidelity National Title Co |
Source: Public Records
Mortgage History
| Date | Status | Borrower | Loan Amount |
|---|---|---|---|
| Previous Owner | Cherrington Rebecca L | $50,000 | |
| Previous Owner | Cherrington Matthew J | $67,500 | |
| Closed | Cherrington Matthew J | $22,500 |
Source: Public Records
Tax History
| Year | Tax Paid | Tax Assessment Tax Assessment Total Assessment is a certain percentage of the fair market value that is determined by local assessors to be the total taxable value of land and additions on the property. | Land | Improvement |
|---|---|---|---|---|
| 2025 | $1,786 | $170,654 | $59,555 | $111,099 |
| 2024 | $1,786 | $167,309 | $58,388 | $108,921 |
| 2023 | $1,763 | $164,030 | $57,244 | $106,786 |
| 2022 | $1,732 | $160,815 | $56,122 | $104,693 |
| 2021 | $1,698 | $157,663 | $55,022 | $102,641 |
| 2020 | $1,693 | $156,047 | $54,458 | $101,589 |
| 2019 | $1,661 | $152,989 | $53,391 | $99,598 |
| 2018 | $1,629 | $149,991 | $52,345 | $97,646 |
| 2017 | $1,602 | $147,051 | $51,319 | $95,732 |
| 2016 | $1,430 | $141,168 | $50,313 | $90,855 |
| 2015 | $1,198 | $117,379 | $49,558 | $67,821 |
| 2014 | $1,181 | $115,081 | $48,588 | $66,493 |
Source: Public Records
Map
Nearby Homes
- 719 Picaso Ln
- 14 Knotts Glen Ct
- 1110 W 8th Ave Unit 1
- 681 Cromwell Dr
- 244 Mission Serra Terrace
- 34 Pebblewood Pines Dr
- 33 Pebblewood Pines Dr
- 33 Quista Dr
- 19 Guynn Bridge Ct
- 1412 N Cherry St Unit 9
- 17 Quista Dr
- 1617 Arcadian Ave
- 1735 Magnolia Ave
- 1421 Citrus Ave
- 165 Rio Lindo Ave
- 1022 Sir William Ct
- 2629 Cliffwood Place
- 1008 Meier Dr
- 1397 Nord Ave
- 1395 Nord Ave
- 730 Sequoyah Ave
- 2165 Holly Ave
- 700 Sequoyah Ave
- 740 Sequoyah Ave
- 2173 Holly Ave
- 721 W 12th Ave
- 731 W 12th Ave
- 748 Sequoyah Ave
- 723 Sequoyah Ave
- 715 W 12th Ave
- 733 Sequoyah Ave
- 0 Sequoyah Ave
- 735 W 12th Ave
- 743 Sequoyah Ave
- 717 W 12th Ave
- 806 Sequoyah Ave
- 2166 Holly Ave
- 2156 Holly Ave
- 2174 Holly Ave
- 749 Sequoyah Ave