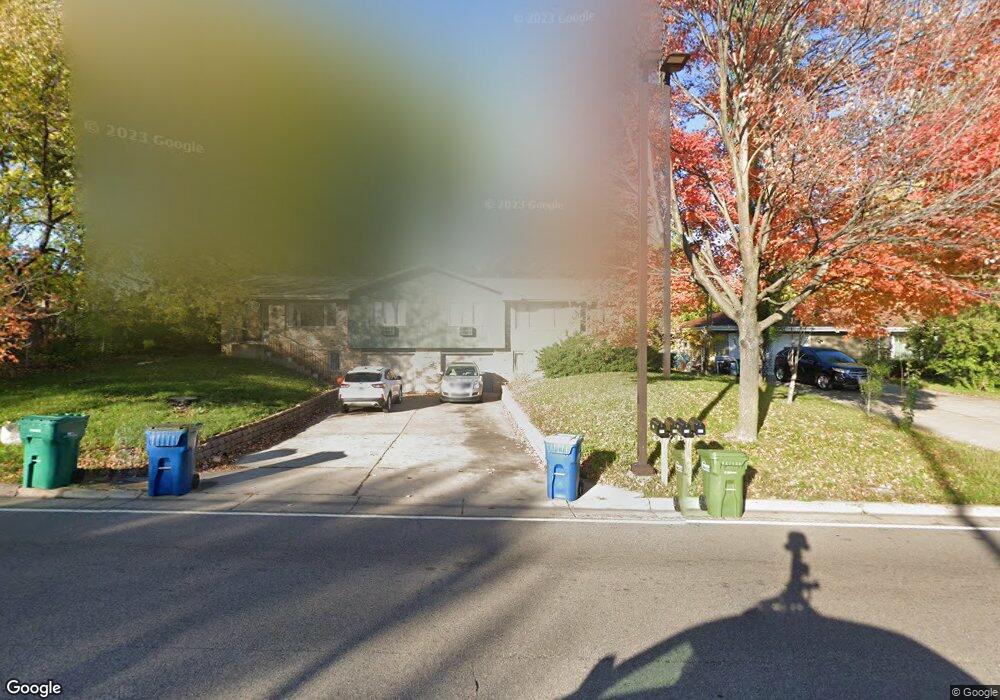
722 Silver Lake Rd NW New Brighton, MN 55112
Estimated Value: $421,558 - $485,000
3
Beds
3
Baths
1,350
Sq Ft
$328/Sq Ft
Est. Value
About This Home
Incredible 3 bed, 2 bath home -- AVAILABLE JUNE 1! Welcome to The Brighton! Here, you're close to great parks, top-rated schools, and plenty of shopping and dining options and just 15 minutes from both downtown Minneapolis and Saint Paul. This recently updated midcentury home is one of two units with an attached garage, lots of storage, and a huge backyard, features spacious rooms and a great floor plan. You'll love the updates, including new flooring, fixtures, paint and more.
Ownership History
Date
Name
Owned For
Owner Type
Purchase Details
Closed on
Jan 27, 2021
Sold by
Jungers and Jessica
Bought by
Jungels Paul and Jungers Eric
Current Estimated Value
Purchase Details
Closed on
Dec 20, 2019
Sold by
Balfany Craig and Balfany Cynthia
Bought by
Jungels Eric and Belisle Jacquelyn
Home Financials for this Owner
Home Financials are based on the most recent Mortgage that was taken out on this home.
Original Mortgage
$228,000
Interest Rate
3.6%
Mortgage Type
New Conventional
Create a Home Valuation Report for This Property
The Home Valuation Report is an in-depth analysis detailing your home's value as well as a comparison with similar homes in the area
Home Values in the Area
Average Home Value in this Area
Purchase History
| Date | Buyer | Sale Price | Title Company |
|---|---|---|---|
| Jungels Paul | $3,000 | Trademark Title | |
| Jungels Paul | -- | Trademark Title Services Inc | |
| Jungels Eric | $304,000 | The Title Group Inc |
Source: Public Records
Mortgage History
| Date | Status | Borrower | Loan Amount |
|---|---|---|---|
| Previous Owner | Jungels Eric | $228,000 |
Source: Public Records
Property History
| Date | Event | Price | List to Sale | Price per Sq Ft |
|---|---|---|---|---|
| 04/26/2025 04/26/25 | Off Market | $2,025 | -- | -- |
| 04/03/2025 04/03/25 | For Rent | $2,025 | -- | -- |
Tax History Compared to Growth
Tax History
| Year | Tax Paid | Tax Assessment Tax Assessment Total Assessment is a certain percentage of the fair market value that is determined by local assessors to be the total taxable value of land and additions on the property. | Land | Improvement |
|---|---|---|---|---|
| 2025 | $5,728 | $428,400 | $78,100 | $350,300 |
| 2023 | $5,728 | $357,800 | $78,100 | $279,700 |
| 2022 | $5,836 | $354,900 | $78,100 | $276,800 |
| 2021 | $5,230 | $335,300 | $78,100 | $257,200 |
| 2020 | $5,576 | $311,700 | $50,800 | $260,900 |
| 2019 | $4,234 | $305,100 | $50,800 | $254,300 |
| 2018 | $2,892 | $238,700 | $50,800 | $187,900 |
| 2017 | $2,732 | $207,600 | $50,800 | $156,800 |
| 2016 | $2,534 | $0 | $0 | $0 |
| 2015 | $2,404 | $179,700 | $50,800 | $128,900 |
| 2014 | $2,480 | $0 | $0 | $0 |
Source: Public Records
Map
Nearby Homes
- 762 Silver Lake Rd NW
- 747 Redwood Ln
- 2391 7th St NW
- 650 23rd Ave NW
- 2792 Forest Dale Rd
- 566 Fairfield Dr NW
- 691 20th Ave NW
- 1112 Pecks Woods Dr Unit 112
- 1267 Brighton Square
- 2980 Bent Tree Hills Dr
- 2723 Innsbruck Dr
- 1244 Highview Dr
- 2209 Forest Dr NE
- 5503 E Bavarian Pass
- 2221 Highland Place
- 4931 Pennine Pass NE
- 2303 3rd St NW
- 5516 E Bavarian Pass
- 5527 E Bavarian Pass
- 5558 Meister Rd
- 740 Silver Lake Rd NW
- 720 Silver Lake Rd NW
- 733 Redwood Ln
- 721 Redwood Ln
- 765 Redwood Ln
- 784 Silver Lake Rd NW
- 741 Silver Lake Rd NW
- 703 Redwood Ln
- 725 Silver Lake Rd NW
- 779 Redwood Ln
- 2555 8th St NW
- 674 Silver Lake Rd NW
- 748 Redwood Ln
- 791 Redwood Ln
- 726 Redwood Ln
- 760 Redwood Ln
- 2585 Forest Dale Rd
- 691 Silver Lake Rd NW
- 784 Redwood Ln
- 2605 Forest Dale Rd