722 Spring Meadow Ln Lebanon, TN 37087
Estimated Value: $285,848 - $381,000
--
Bed
2
Baths
1,210
Sq Ft
$280/Sq Ft
Est. Value
About This Home
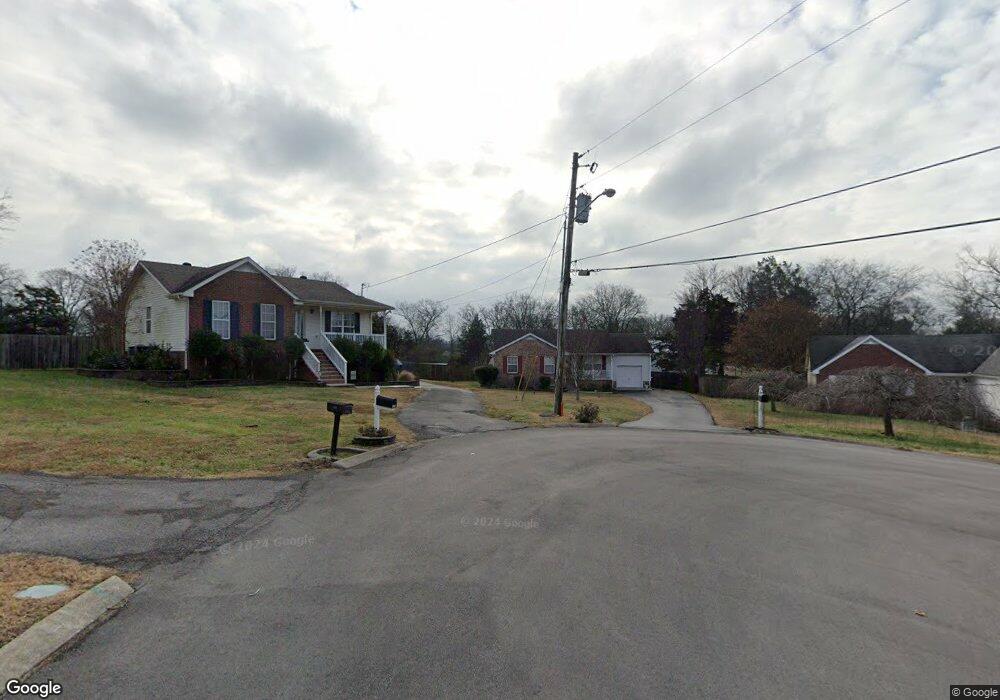
This home is located at 722 Spring Meadow Ln, Lebanon, TN 37087 and is currently estimated at $338,712, approximately $279 per square foot. 722 Spring Meadow Ln is a home located in Wilson County with nearby schools including Byars Dowdy Elementary School, Winfree Bryant Middle School, and Lebanon High School.
Ownership History
Date
Name
Owned For
Owner Type
Purchase Details
Closed on
Dec 16, 2009
Sold by
Clemmons Brandon J
Bought by
Clemmons Phyllis S
Current Estimated Value
Purchase Details
Closed on
Jul 27, 2001
Sold by
Grooms Kimberly J and Grooms Douglas
Bought by
Clemons Brandon J
Home Financials for this Owner
Home Financials are based on the most recent Mortgage that was taken out on this home.
Original Mortgage
$104,240
Interest Rate
7.1%
Purchase Details
Closed on
Oct 24, 1997
Bought by
Clay Kimberly Jo
Purchase Details
Closed on
Aug 13, 1996
Bought by
Fieldstone Inc
Purchase Details
Closed on
Sep 8, 1993
Bought by
Lmr Land Company Ltd Attn: Brock Rust #
Purchase Details
Closed on
Mar 27, 1984
Bought by
Church College St Church Of Christ
Create a Home Valuation Report for This Property
The Home Valuation Report is an in-depth analysis detailing your home's value as well as a comparison with similar homes in the area
Home Values in the Area
Average Home Value in this Area
Purchase History
| Date | Buyer | Sale Price | Title Company |
|---|---|---|---|
| Clemmons Phyllis S | $138,000 | -- | |
| Clemons Brandon J | $108,000 | -- | |
| Clay Kimberly Jo | $93,200 | -- | |
| Fieldstone Inc | $75,000 | -- | |
| Lmr Land Company Ltd Attn: Brock Rust # | -- | -- | |
| Hearthside Inc | -- | -- | |
| Church College St Church Of Christ | -- | -- |
Source: Public Records
Mortgage History
| Date | Status | Borrower | Loan Amount |
|---|---|---|---|
| Previous Owner | Church College St Church Of Christ | $104,240 |
Source: Public Records
Tax History Compared to Growth
Tax History
| Year | Tax Paid | Tax Assessment Tax Assessment Total Assessment is a certain percentage of the fair market value that is determined by local assessors to be the total taxable value of land and additions on the property. | Land | Improvement |
|---|---|---|---|---|
| 2024 | $1,188 | $53,875 | $21,250 | $32,625 |
| 2022 | $1,557 | $53,875 | $21,250 | $32,625 |
| 2021 | $1,558 | $53,875 | $21,250 | $32,625 |
| 2020 | $1,526 | $53,875 | $21,250 | $32,625 |
| 2019 | $348 | $40,625 | $9,025 | $31,600 |
| 2018 | $1,425 | $40,625 | $9,025 | $31,600 |
| 2017 | $1,425 | $40,625 | $9,025 | $31,600 |
| 2016 | $1,425 | $40,625 | $9,025 | $31,600 |
| 2015 | $1,474 | $40,625 | $9,025 | $31,600 |
| 2014 | $1,142 | $31,469 | $0 | $0 |
Source: Public Records
Map
Nearby Homes
- 619 W Spring St
- 604 Pennsylvania Annex
- 865 Knox Crest Dr
- 305 Castle Heights Ave
- 306 Pennsylvania Ave
- 113 Gordon Dr
- 408 Dawson Ln
- 126 Oak Hill Dr
- 311 Pennsylvania Ave
- 140 N Tarver Ave
- 509 B Castle Heights Ave
- 2 Phillips Ct
- 7 Baker Ct
- 4 Hurd Ct
- 114 N Hatton Ave
- 411 Hill St
- 411 Hill St Unit A
- 123 N Hatton Ave
- 438 Leeville Pike
- 127 S Greenwood St
- 720 Spring Meadow Ln
- 724 Spring Meadow Ln
- 726 Spring Meadow Ln
- 713 W Spring St
- 721 Spring Meadow Ln
- 715 W Spring St
- 711 W Spring St
- 800 Spring Meadow Ln
- 717 W Spring St
- 723 Spring Meadow Ln
- 725 Spring Meadow Ln
- 709 W Spring St
- 802 Spring Meadow Ln
- 801 W Spring St
- 707 W Spring St
- 801 Spring Meadow Ln
- 118 Castle Heights Ave
- 803 W Spring St
- 705 W Spring St
- 803 Spring Meadow Ln