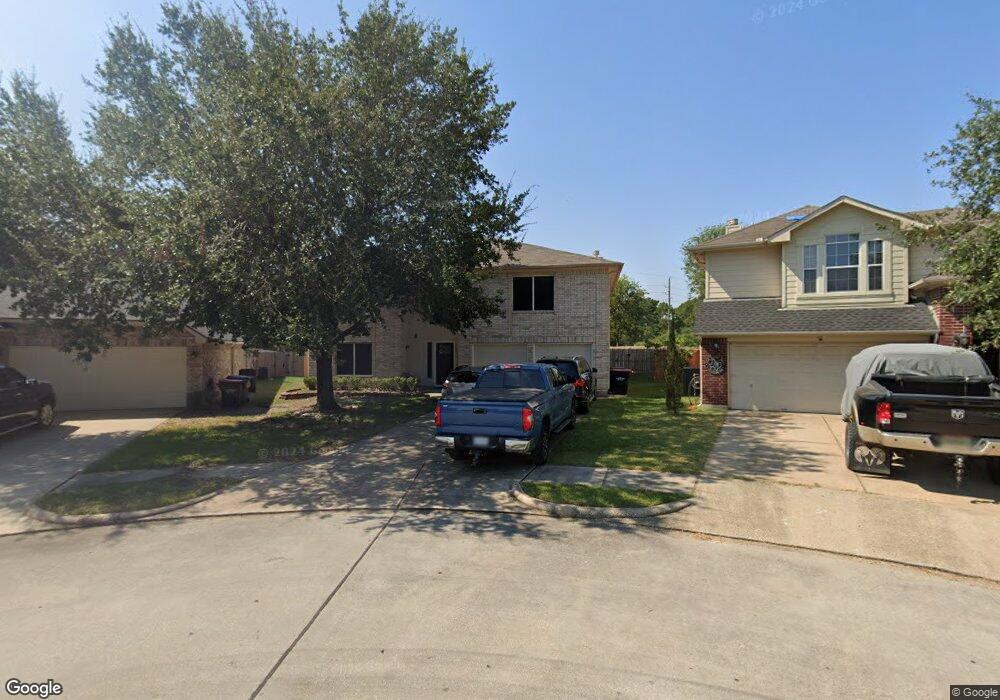
722 Vista Grove Cir Unit 1 Houston, TX 77073
Northview NeighborhoodEstimated Value: $280,000 - $350,000
5
Beds
3
Baths
3,810
Sq Ft
$86/Sq Ft
Est. Value
About This Home
This home is located at 722 Vista Grove Cir Unit 1, Houston, TX 77073 and is currently estimated at $328,989, approximately $86 per square foot. 722 Vista Grove Cir Unit 1 is a home located in Harris County with nearby schools including Carolee Booker Elementary School, Ricky C. Bailey Middle School, and Andy Dekaney High School.
Ownership History
Date
Name
Owned For
Owner Type
Purchase Details
Closed on
Apr 25, 2023
Sold by
Amh 2014-1 Borrower Llc
Bought by
Bonilla Jose Elmer and Bonilla Alba
Current Estimated Value
Home Financials for this Owner
Home Financials are based on the most recent Mortgage that was taken out on this home.
Original Mortgage
$188,000
Outstanding Balance
$182,775
Interest Rate
6.6%
Mortgage Type
New Conventional
Estimated Equity
$146,214
Purchase Details
Closed on
Oct 2, 2012
Sold by
Tran Tony and The Bank Of New York Mellon
Bought by
Ah4r I Tx Llc
Purchase Details
Closed on
May 25, 2012
Sold by
Nguyen Thai Hung
Bought by
Tran Tony
Purchase Details
Closed on
Aug 3, 2011
Sold by
Tran Tony
Bought by
Nguyen Thai Hung
Home Financials for this Owner
Home Financials are based on the most recent Mortgage that was taken out on this home.
Original Mortgage
$154,758
Interest Rate
4.52%
Mortgage Type
Seller Take Back
Create a Home Valuation Report for This Property
The Home Valuation Report is an in-depth analysis detailing your home's value as well as a comparison with similar homes in the area
Home Values in the Area
Average Home Value in this Area
Purchase History
| Date | Buyer | Sale Price | Title Company |
|---|---|---|---|
| Bonilla Jose Elmer | -- | None Listed On Document | |
| Ah4r I Tx Llc | $119,701 | None Available | |
| Tran Tony | -- | None Available | |
| Nguyen Thai Hung | -- | None Available |
Source: Public Records
Mortgage History
| Date | Status | Borrower | Loan Amount |
|---|---|---|---|
| Open | Bonilla Jose Elmer | $188,000 | |
| Previous Owner | Nguyen Thai Hung | $154,758 |
Source: Public Records
Tax History Compared to Growth
Tax History
| Year | Tax Paid | Tax Assessment Tax Assessment Total Assessment is a certain percentage of the fair market value that is determined by local assessors to be the total taxable value of land and additions on the property. | Land | Improvement |
|---|---|---|---|---|
| 2025 | $8,564 | $366,491 | $49,359 | $317,132 |
| 2024 | $8,564 | $370,719 | $49,359 | $321,360 |
| 2023 | $8,564 | $361,216 | $49,359 | $311,857 |
| 2022 | $2,102 | $304,691 | $27,783 | $276,908 |
| 2021 | $6,701 | $262,240 | $27,783 | $234,457 |
| 2020 | $6,401 | $233,225 | $18,325 | $214,900 |
| 2019 | $6,230 | $216,847 | $18,325 | $198,522 |
| 2018 | $6,046 | $200,200 | $18,325 | $181,875 |
| 2017 | $5,712 | $200,200 | $18,325 | $181,875 |
| 2016 | $5,107 | $179,000 | $18,325 | $160,675 |
| 2015 | $3,195 | $190,688 | $18,325 | $172,363 |
| 2014 | $3,195 | $169,421 | $18,325 | $151,096 |
Source: Public Records
Map
Nearby Homes
- 20930 Vista Trace Dr
- 20943 Vista Trace Dr
- 1019 Sawgrass Ridge Ln
- 21002 Vista Trace Dr
- 21010 Vista Trace Dr
- 21039 Vista Trail Ct
- 930 Sycamore Ridge Ln
- 15722 Youpon Valley Dr
- 1230 Piedmont Creek Trail
- 21127 Gatepoint Dr
- 443 Gateship Dr
- 20906 S Hide Ct
- 15938 Wisteria Hill St
- 15718 Colonial Bridge Ln
- 20919 New Leaf Ct
- 15930 Pin Oak Ridge St
- 922 N Sky Dr
- 16010 Pin Oak Ridge St
- 931 N Sky Dr
- 0 Imperial Valley Dr Unit 32523297
- 722 Vista Grove Cir
- 718 Vista Grove Cir
- 726 Vista Grove Cir
- 802 Hillock Bluff Cir
- 730 Vista Grove Cir
- 714 Vista Grove Cir
- 806 Hillock Bluff Cir
- 734 Vista Grove Cir
- 710 Vista Grove Cir
- 810 Hillock Bluff Cir
- 746 Hillock Bluff Cir
- 814 Hillock Bluff Cir
- 706 Vista Grove Cir
- 742 Hillock Bluff Cir
- 702 Vista Grove Cir
- 818 Hillock Bluff Cir
- 738 Hillock Bluff Cir
- 815 Hillock Bluff Cir
- 20903 Grovedale Dr
- 802 Vista Grove Cir