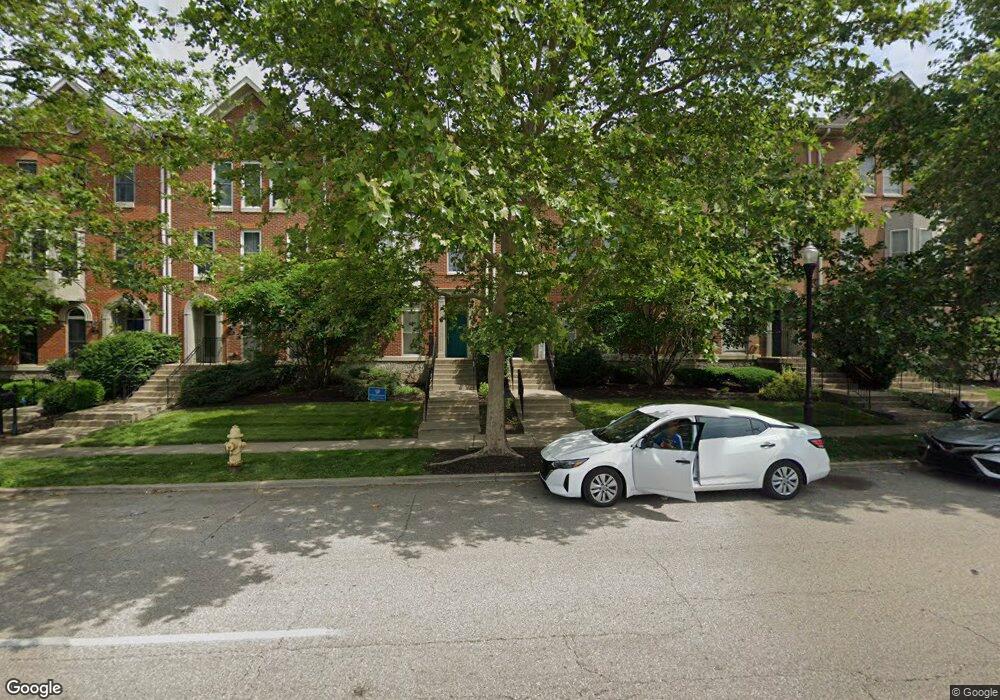
722 W Court St Cincinnati, OH 45203
West End NeighborhoodEstimated Value: $303,000 - $487,000
4
Beds
3
Baths
2,181
Sq Ft
$187/Sq Ft
Est. Value
About This Home
This home is located at 722 W Court St, Cincinnati, OH 45203 and is currently estimated at $407,436, approximately $186 per square foot. 722 W Court St is a home located in Hamilton County with nearby schools including Hays-Porter School, Robert A. Taft Information Technology High School, and Gilbert A. Dater High School.
Ownership History
Date
Name
Owned For
Owner Type
Purchase Details
Closed on
Feb 11, 2002
Sold by
Cincinnati Metropolitan Hsng Authority
Bought by
Moore Darlene A
Current Estimated Value
Home Financials for this Owner
Home Financials are based on the most recent Mortgage that was taken out on this home.
Original Mortgage
$107,500
Interest Rate
6.25%
Create a Home Valuation Report for This Property
The Home Valuation Report is an in-depth analysis detailing your home's value as well as a comparison with similar homes in the area
Home Values in the Area
Average Home Value in this Area
Purchase History
| Date | Buyer | Sale Price | Title Company |
|---|---|---|---|
| Moore Darlene A | -- | -- |
Source: Public Records
Mortgage History
| Date | Status | Borrower | Loan Amount |
|---|---|---|---|
| Previous Owner | Moore Darlene A | $107,500 | |
| Closed | Moore Darlene A | $50,000 |
Source: Public Records
Tax History Compared to Growth
Tax History
| Year | Tax Paid | Tax Assessment Tax Assessment Total Assessment is a certain percentage of the fair market value that is determined by local assessors to be the total taxable value of land and additions on the property. | Land | Improvement |
|---|---|---|---|---|
| 2024 | $6,793 | $113,796 | $30,450 | $83,346 |
| 2023 | $6,946 | $113,796 | $30,450 | $83,346 |
| 2022 | $5,596 | $82,187 | $9,870 | $72,317 |
| 2021 | $5,385 | $82,187 | $9,870 | $72,317 |
| 2020 | $5,543 | $82,187 | $9,870 | $72,317 |
| 2019 | $5,050 | $68,488 | $8,225 | $60,263 |
| 2018 | $5,048 | $68,488 | $8,225 | $60,263 |
| 2017 | $576 | $68,488 | $8,225 | $60,263 |
| 2016 | $514 | $72,153 | $7,238 | $64,915 |
| 2015 | $463 | $72,153 | $7,238 | $64,915 |
| 2014 | $467 | $72,153 | $7,238 | $64,915 |
| 2013 | $540 | $81,991 | $8,225 | $73,766 |
Source: Public Records
Map
Nearby Homes