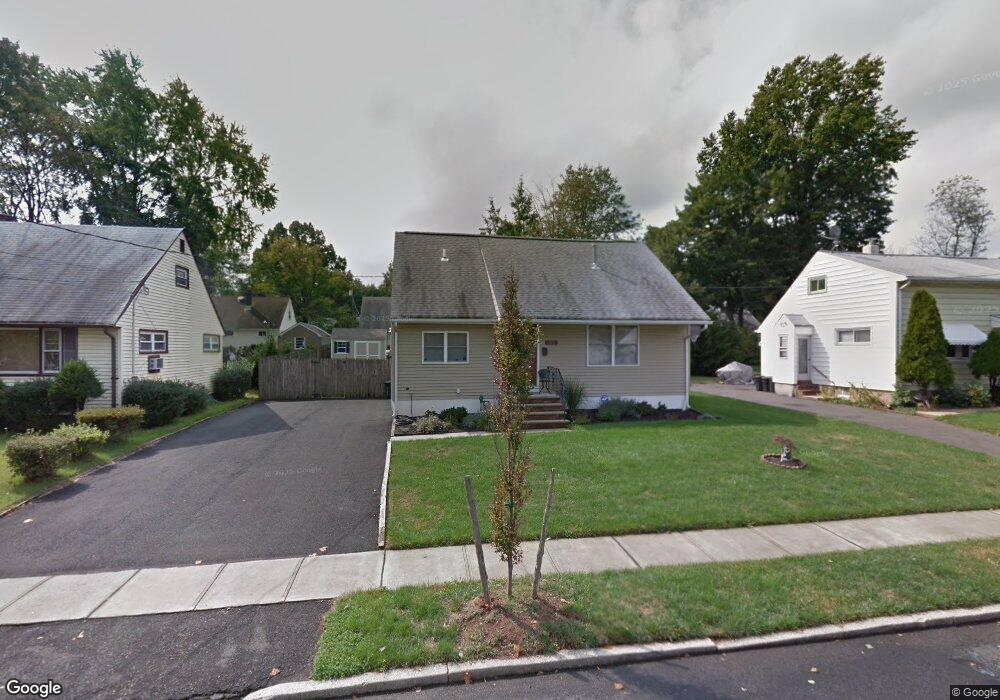
722 Washington Ave Roselle, NJ 07203
Estimated Value: $502,000 - $548,000
--
Bed
--
Bath
1,632
Sq Ft
$324/Sq Ft
Est. Value
About This Home
This home is located at 722 Washington Ave, Roselle, NJ 07203 and is currently estimated at $529,567, approximately $324 per square foot. 722 Washington Ave is a home located in Union County with nearby schools including Washington Elementary School, Leonard V. Moore Middle School, and Grace Wilday Junior High School.
Ownership History
Date
Name
Owned For
Owner Type
Purchase Details
Closed on
Mar 11, 2010
Sold by
Jazikoff Greg and Shane Paul
Bought by
Norville Sonia
Current Estimated Value
Home Financials for this Owner
Home Financials are based on the most recent Mortgage that was taken out on this home.
Original Mortgage
$206,196
Outstanding Balance
$137,615
Interest Rate
5.12%
Mortgage Type
FHA
Estimated Equity
$391,952
Purchase Details
Closed on
May 30, 2006
Sold by
Piquion Ricky Clark
Bought by
Jazikoff Greg and Paul Shane
Home Financials for this Owner
Home Financials are based on the most recent Mortgage that was taken out on this home.
Original Mortgage
$205,600
Interest Rate
9.77%
Mortgage Type
Adjustable Rate Mortgage/ARM
Purchase Details
Closed on
Jul 29, 2004
Sold by
Reich Frances
Bought by
Aquion Ricky
Home Financials for this Owner
Home Financials are based on the most recent Mortgage that was taken out on this home.
Original Mortgage
$189,703
Interest Rate
6.03%
Create a Home Valuation Report for This Property
The Home Valuation Report is an in-depth analysis detailing your home's value as well as a comparison with similar homes in the area
Home Values in the Area
Average Home Value in this Area
Purchase History
| Date | Buyer | Sale Price | Title Company |
|---|---|---|---|
| Norville Sonia | $210,000 | Chicago Title Insurance Co | |
| Jazikoff Greg | $257,000 | -- | |
| Aquion Ricky | $194,900 | -- |
Source: Public Records
Mortgage History
| Date | Status | Borrower | Loan Amount |
|---|---|---|---|
| Open | Norville Sonia | $206,196 | |
| Previous Owner | Jazikoff Greg | $205,600 | |
| Previous Owner | Aquion Ricky | $189,703 |
Source: Public Records
Tax History Compared to Growth
Tax History
| Year | Tax Paid | Tax Assessment Tax Assessment Total Assessment is a certain percentage of the fair market value that is determined by local assessors to be the total taxable value of land and additions on the property. | Land | Improvement |
|---|---|---|---|---|
| 2025 | $11,060 | $127,200 | $70,000 | $57,200 |
| 2024 | $10,783 | $127,200 | $70,000 | $57,200 |
| 2023 | $10,783 | $127,200 | $70,000 | $57,200 |
| 2022 | $10,858 | $127,200 | $70,000 | $57,200 |
| 2021 | $10,793 | $127,200 | $70,000 | $57,200 |
| 2020 | $10,759 | $127,200 | $70,000 | $57,200 |
| 2019 | $10,621 | $127,200 | $70,000 | $57,200 |
| 2018 | $10,563 | $127,200 | $70,000 | $57,200 |
| 2017 | $10,507 | $127,200 | $70,000 | $57,200 |
| 2016 | $10,275 | $127,200 | $70,000 | $57,200 |
| 2015 | $10,274 | $127,200 | $70,000 | $57,200 |
| 2014 | $11,283 | $143,700 | $70,000 | $73,700 |
Source: Public Records
Map
Nearby Homes
- 540 W 7th Ave
- 13 Independence Dr
- 38 Independence Dr
- 538 Dietz St
- 2513 N Wood Ave
- 446 W 6th Ave
- 38 Pallant Ave
- 217 Grace St
- 54 Pallant Ave
- 448 Cristiani St
- 221 Douglas Rd
- 53 Pallant Ave
- 569 Berlant Ave
- 63 Elmwood Terrace
- 57 Berlant Ave
- 74 Raritan Rd
- 443 Wheatsheaf Rd
- 826 Amsterdam Ave
- 113 Raritan Rd
- 323 Dermody St
- 718 Washington Ave
- 726 Washington Ave
- 723 Franklin Terrace
- 719 Franklin Terrace
- 727 Franklin Terrace
- 714 Washington Ave
- 734 Washington Ave
- 508 W 9th Ave
- 715 Franklin Terrace
- 721 Washington Ave
- 725 Washington Ave
- 735 Franklin Terrace
- 2 Colonial Rd
- 710 Washington Ave
- 729 Washington Ave
- 711 Franklin Terrace
- 733 Washington Ave
- 6 Colonial Rd
- 722 Franklin Terrace
- 702 Washington Ave