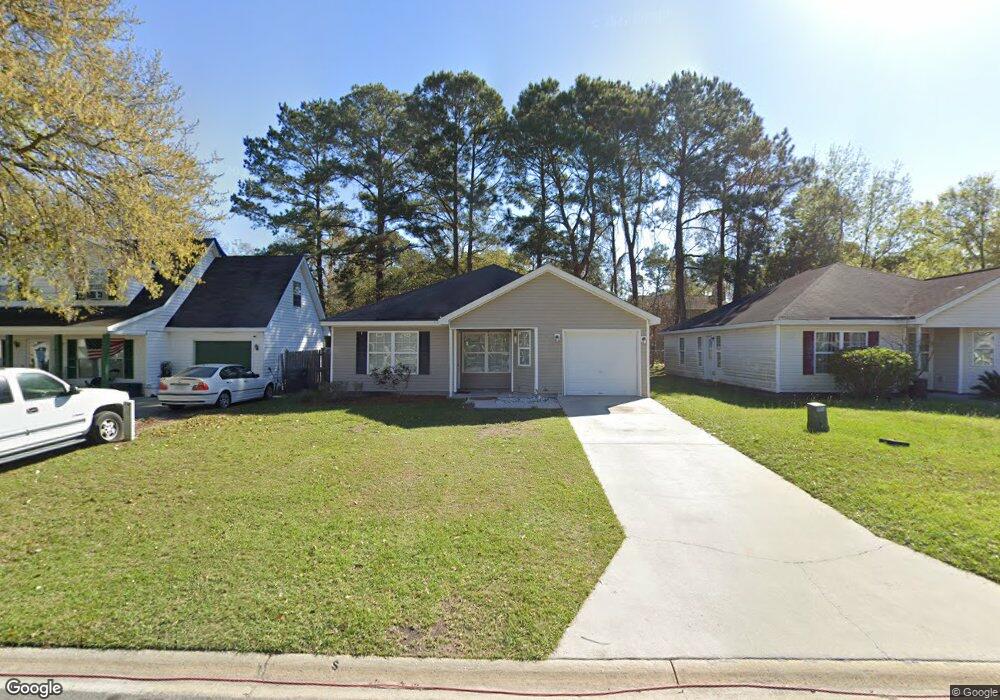
7220 Grant St Savannah, GA 31406
Norwood-Wylly Island NeighborhoodEstimated Value: $74,000 - $291,000
3
Beds
2
Baths
1,248
Sq Ft
$182/Sq Ft
Est. Value
About This Home
This home is located at 7220 Grant St, Savannah, GA 31406 and is currently estimated at $226,953, approximately $181 per square foot. 7220 Grant St is a home located in Chatham County with nearby schools including Isle Of Hope School, Johnson High School, and Oglethorpe Charter School.
Ownership History
Date
Name
Owned For
Owner Type
Purchase Details
Closed on
Dec 6, 2016
Sold by
Walker Henry B
Bought by
Sandfly Associates Llp
Current Estimated Value
Purchase Details
Closed on
May 6, 2009
Sold by
Sandfly Associates Llp
Bought by
Walker Henry B and Walker Lucille
Home Financials for this Owner
Home Financials are based on the most recent Mortgage that was taken out on this home.
Original Mortgage
$105,500
Interest Rate
4.89%
Mortgage Type
New Conventional
Create a Home Valuation Report for This Property
The Home Valuation Report is an in-depth analysis detailing your home's value as well as a comparison with similar homes in the area
Home Values in the Area
Average Home Value in this Area
Purchase History
| Date | Buyer | Sale Price | Title Company |
|---|---|---|---|
| Sandfly Associates Llp | $75,000 | -- | |
| Walker Henry B | $110,000 | -- | |
| Sandfly Associates Llp | -- | -- |
Source: Public Records
Mortgage History
| Date | Status | Borrower | Loan Amount |
|---|---|---|---|
| Previous Owner | Sandfly Associates Llp | $105,500 |
Source: Public Records
Tax History Compared to Growth
Tax History
| Year | Tax Paid | Tax Assessment Tax Assessment Total Assessment is a certain percentage of the fair market value that is determined by local assessors to be the total taxable value of land and additions on the property. | Land | Improvement |
|---|---|---|---|---|
| 2025 | $6,888 | $107,880 | $18,000 | $89,880 |
| 2024 | $6,888 | $99,320 | $16,000 | $83,320 |
| 2023 | $4,126 | $84,720 | $16,000 | $68,720 |
| 2022 | $1,942 | $68,800 | $6,800 | $62,000 |
| 2021 | $1,903 | $54,520 | $6,800 | $47,720 |
| 2020 | $1,718 | $48,640 | $6,800 | $41,840 |
| 2019 | $2,661 | $47,080 | $6,800 | $40,280 |
| 2018 | $1,823 | $45,520 | $6,800 | $38,720 |
| 2017 | $1,773 | $45,840 | $6,800 | $39,040 |
| 2016 | $1,478 | $42,320 | $3,840 | $38,480 |
| 2015 | $2,211 | $42,800 | $3,840 | $38,960 |
| 2014 | $2,192 | $43,400 | $0 | $0 |
Source: Public Records
Map
Nearby Homes
- 7216 Garfield St
- 7206 Garfield St
- 4 Cross Bow Ct
- 7308 Garfield St
- 0 Albert St Unit SA337026
- 111 S Robinhood Dr
- 7014 Key St
- 19 Robin Hood Dr
- 117 Fox Chase Rd
- 109 Canter Ct
- 7 Bakers Crossing
- 2511 Little John Ct
- 6929 Key St
- 19 Arline Dr
- 20 Lansing Ave Unit C
- 9 Mulberry Ct
- 114 Lakeview Ct
- 9 Gerald Dr
- 0 Skinner Place
- 0 Skinner Place Unit 10588694
- 7222 Grant St
- 7218 Grant St
- 7224 Grant St
- 7223 Garfield St
- 7221 Garfield St
- 7216 Grant St
- 7225 Garfield St
- 7227 Garfield St
- 7226 Grant St
- 7213 Grant St
- 7215 Grant St
- 7219 Garfield St
- 7211 Grant St
- 7217 Grant St
- 7214 Grant St
- 7217 Garfield St
- 7229 Garfield St
- 7228 Grant St
- 7209 Grant St
- 7219 Grant St