7220 Mountain Laurel Way Stockbridge, GA 30281
Estimated Value: $255,418 - $284,000
4
Beds
3
Baths
1,915
Sq Ft
$142/Sq Ft
Est. Value
About This Home
This home is located at 7220 Mountain Laurel Way, Stockbridge, GA 30281 and is currently estimated at $272,105, approximately $142 per square foot. 7220 Mountain Laurel Way is a home located in Clayton County with nearby schools including Mt. Zion Primary School, Mount Zion Elementary School, and Rex Mill Middle School.
Ownership History
Date
Name
Owned For
Owner Type
Purchase Details
Closed on
Nov 2, 2009
Sold by
Hud-Housing Of Urban Dev
Bought by
Hall Katuska L
Current Estimated Value
Home Financials for this Owner
Home Financials are based on the most recent Mortgage that was taken out on this home.
Original Mortgage
$98,505
Outstanding Balance
$64,089
Interest Rate
4.93%
Mortgage Type
FHA
Estimated Equity
$208,016
Purchase Details
Closed on
Mar 3, 2009
Sold by
Countrywide Hm Loans Servicing
Bought by
Hud-Housing Of Urban Dev
Purchase Details
Closed on
Oct 19, 2005
Sold by
Homelife Communities Clayton Inc
Bought by
Bryant Brandy N and Bryant Rodedrick
Home Financials for this Owner
Home Financials are based on the most recent Mortgage that was taken out on this home.
Original Mortgage
$157,661
Interest Rate
5.9%
Mortgage Type
VA
Create a Home Valuation Report for This Property
The Home Valuation Report is an in-depth analysis detailing your home's value as well as a comparison with similar homes in the area
Home Values in the Area
Average Home Value in this Area
Purchase History
| Date | Buyer | Sale Price | Title Company |
|---|---|---|---|
| Hall Katuska L | -- | -- | |
| Hud-Housing Of Urban Dev | -- | -- | |
| Countrywide Hm Loans Servicing | $169,170 | -- | |
| Bryant Brandy N | $160,200 | -- |
Source: Public Records
Mortgage History
| Date | Status | Borrower | Loan Amount |
|---|---|---|---|
| Open | Hall Katuska L | $98,505 | |
| Previous Owner | Bryant Brandy N | $157,661 |
Source: Public Records
Tax History Compared to Growth
Tax History
| Year | Tax Paid | Tax Assessment Tax Assessment Total Assessment is a certain percentage of the fair market value that is determined by local assessors to be the total taxable value of land and additions on the property. | Land | Improvement |
|---|---|---|---|---|
| 2024 | $3,448 | $97,400 | $9,600 | $87,800 |
| 2023 | $3,046 | $84,360 | $9,600 | $74,760 |
| 2022 | $2,104 | $62,640 | $9,600 | $53,040 |
| 2021 | $2,018 | $60,120 | $9,600 | $50,520 |
| 2020 | $2,049 | $60,293 | $9,600 | $50,693 |
| 2019 | $1,639 | $49,437 | $8,400 | $41,037 |
| 2018 | $1,683 | $50,521 | $8,400 | $42,121 |
| 2017 | $1,557 | $47,326 | $8,400 | $38,926 |
| 2016 | $1,133 | $36,901 | $8,400 | $28,501 |
| 2015 | $978 | $0 | $0 | $0 |
| 2014 | $675 | $26,002 | $9,600 | $16,402 |
Source: Public Records
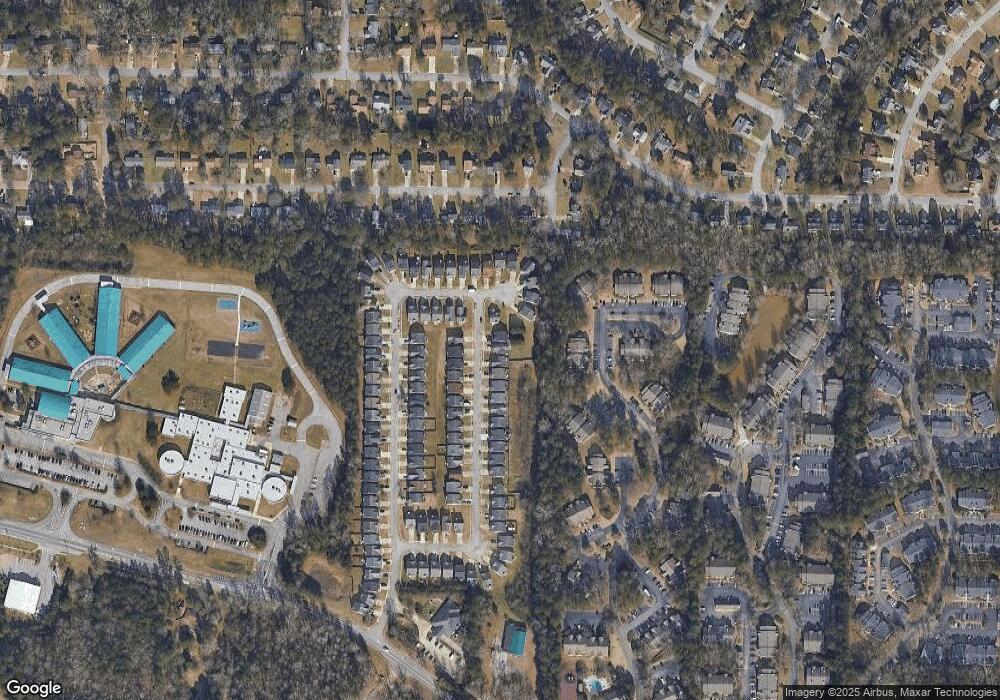
Map
Nearby Homes
- 7161 Laurel Creek Dr
- 2973 Botany Dr
- 3193 Medina Dr
- 3087 Drexel Ln
- 7101 Hazelwood Dr Unit 8
- 2959 Drexel Ln
- 7074 Babbling Brook Dr
- 3189 Glen Hollow Dr
- 3140 Glen Hollow Dr
- 3145 Deerfield Way
- 3353 Medina Dr
- 6968 Fielder Rd
- 2877 Kensington Way
- 6921 Babbling Brook Dr
- 7436 Fielder Rd
- 3401 Mosswood Ln
- 7442 Pine Brook Rd
- 2919 Cushing Ct Unit 2
- 3460 Mount Zion Rd
- 7224 Mountain Laurel Way
- 7224 Mountain Laurel Way
- 7216 Mountain Laurel Way
- 7228 Mountain Laurel Way
- 7147 Laurel Creek Dr
- 7232 Mountain Laurel Way
- 7153 Laurel Creek Dr
- 7236 Mountain Laurel Way
- 7221 Mountain Laurel Way
- 7217 Mountain Laurel Way
- 0 Laurel Creek Dr Unit 7107016
- 0 Laurel Creek Dr
- 7176 Laurel Creek Dr
- 7225 Mountain Laurel Way
- 7229 Mountain Laurel Way
- 5489 Laurel Ct
- 7240 Mountain Laurel Way
- 7155 Laurel Creek Dr
- 7233 Mountain Laurel Way
- 7180 Laurel Creek Dr