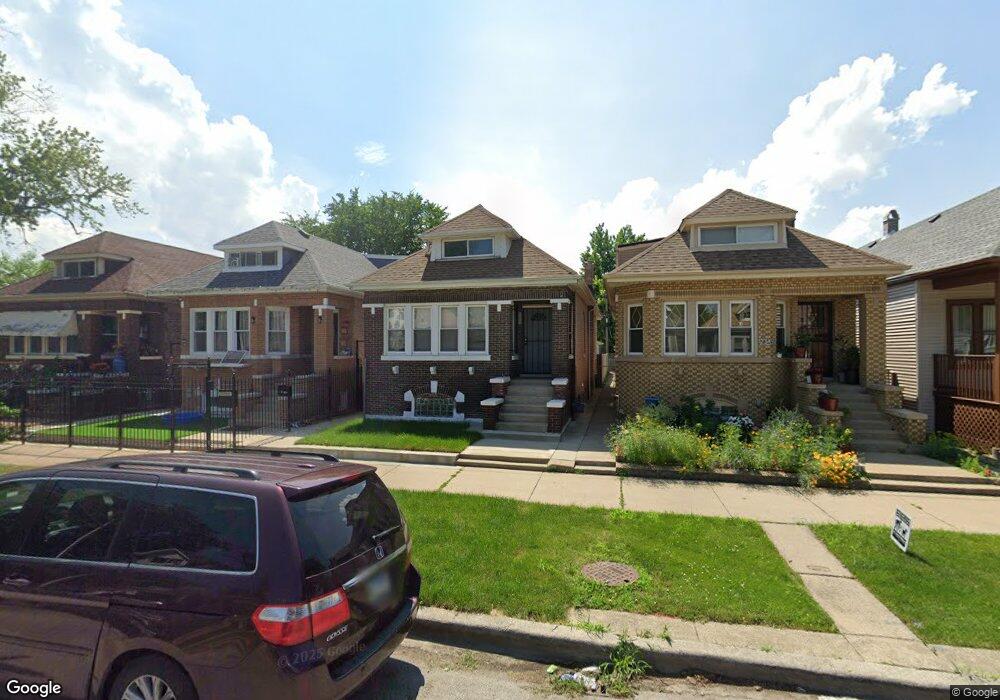
7220 S Winchester Ave Chicago, IL 60636
Englewood NeighborhoodEstimated Value: $157,038 - $201,000
2
Beds
1
Bath
967
Sq Ft
$177/Sq Ft
Est. Value
About This Home
This home is located at 7220 S Winchester Ave, Chicago, IL 60636 and is currently estimated at $170,760, approximately $176 per square foot. 7220 S Winchester Ave is a home located in Cook County with nearby schools including Randolph Elementary School and The Montessori School of Englewood Charter School.
Ownership History
Date
Name
Owned For
Owner Type
Purchase Details
Closed on
Aug 22, 2017
Sold by
Bank Of America N A
Bought by
Galvan Ma Guadalupe and Galvan Serafin
Current Estimated Value
Purchase Details
Closed on
Aug 16, 2017
Sold by
Dent Mary L and Dent Mary
Bought by
Bank Of America N A
Purchase Details
Closed on
Jan 26, 2009
Sold by
Dent James L
Bought by
Dent James and Dent Mary
Home Financials for this Owner
Home Financials are based on the most recent Mortgage that was taken out on this home.
Original Mortgage
$109,971
Interest Rate
5.03%
Mortgage Type
FHA
Purchase Details
Closed on
Dec 23, 1999
Sold by
Dent James L and Dent Mary L
Bought by
Dent James L
Home Financials for this Owner
Home Financials are based on the most recent Mortgage that was taken out on this home.
Original Mortgage
$71,250
Interest Rate
11.9%
Create a Home Valuation Report for This Property
The Home Valuation Report is an in-depth analysis detailing your home's value as well as a comparison with similar homes in the area
Home Values in the Area
Average Home Value in this Area
Purchase History
| Date | Buyer | Sale Price | Title Company |
|---|---|---|---|
| Galvan Ma Guadalupe | $15,000 | Attorney | |
| Bank Of America N A | -- | None Available | |
| Dent James | -- | Stewart Title Company | |
| Dent James L | -- | -- |
Source: Public Records
Mortgage History
| Date | Status | Borrower | Loan Amount |
|---|---|---|---|
| Previous Owner | Dent James | $109,971 | |
| Previous Owner | Dent James L | $71,250 |
Source: Public Records
Tax History
| Year | Tax Paid | Tax Assessment Tax Assessment Total Assessment is a certain percentage of the fair market value that is determined by local assessors to be the total taxable value of land and additions on the property. | Land | Improvement |
|---|---|---|---|---|
| 2025 | $2,110 | $8,201 | $938 | $7,263 |
| 2024 | $2,110 | $8,201 | $938 | $7,263 |
| 2023 | $2,057 | $10,000 | $2,031 | $7,969 |
| 2022 | $2,057 | $10,000 | $2,031 | $7,969 |
| 2021 | $2,011 | $9,999 | $2,031 | $7,968 |
| 2020 | $1,357 | $6,091 | $2,031 | $4,060 |
| 2019 | $1,360 | $6,768 | $2,031 | $4,737 |
| 2018 | $1,337 | $6,768 | $2,031 | $4,737 |
| 2017 | $878 | $7,455 | $1,875 | $5,580 |
| 2016 | $993 | $7,455 | $1,875 | $5,580 |
| 2015 | $885 | $7,455 | $1,875 | $5,580 |
| 2014 | $818 | $6,977 | $1,718 | $5,259 |
| 2013 | $791 | $6,977 | $1,718 | $5,259 |
Source: Public Records
Map
Nearby Homes
- 7248 S Wolcott Ave
- 7142 S Damen Ave
- 7301 S Seeley Ave
- 7242 S Honore St
- 7154 S Honore St
- 7130 S Seeley Ave
- 7131 S Hoyne Ave
- 2102 W 73rd St
- 7246 S Wood St
- 7332 S Honore St
- 7047 S Winchester Ave
- 1851 W 71st St
- 7219 S Wood St
- 7243 S Wood St
- 7149 S Wood St
- 7330 S Wood St
- 7131 S Wood St
- 7028 S Honore St
- 2133 W 71st St
- 2107 W 70th Place
- 7224 S Winchester Ave
- 7218 S Winchester Ave
- 7226 S Winchester Ave
- 7216 S Winchester Ave
- 7212 S Winchester Ave
- 7228 S Winchester Ave
- 7210 S Winchester Ave
- 7232 S Winchester Ave
- 7208 S Winchester Ave
- 7221 S Damen Ave
- 7223 S Damen Ave
- 7219 S Damen Ave
- 7227 S Damen Ave
- 7217 S Damen Ave
- 7234 S Winchester Ave
- 7213 S Damen Ave
- 7204 S Winchester Ave
- 7229 S Damen Ave
- 7211 S Damen Ave
- 7231 S Damen Ave
Your Personal Tour Guide
Ask me questions while you tour the home.