Estimated Value: $211,000 - $232,000
3
Beds
2
Baths
1,220
Sq Ft
$182/Sq Ft
Est. Value
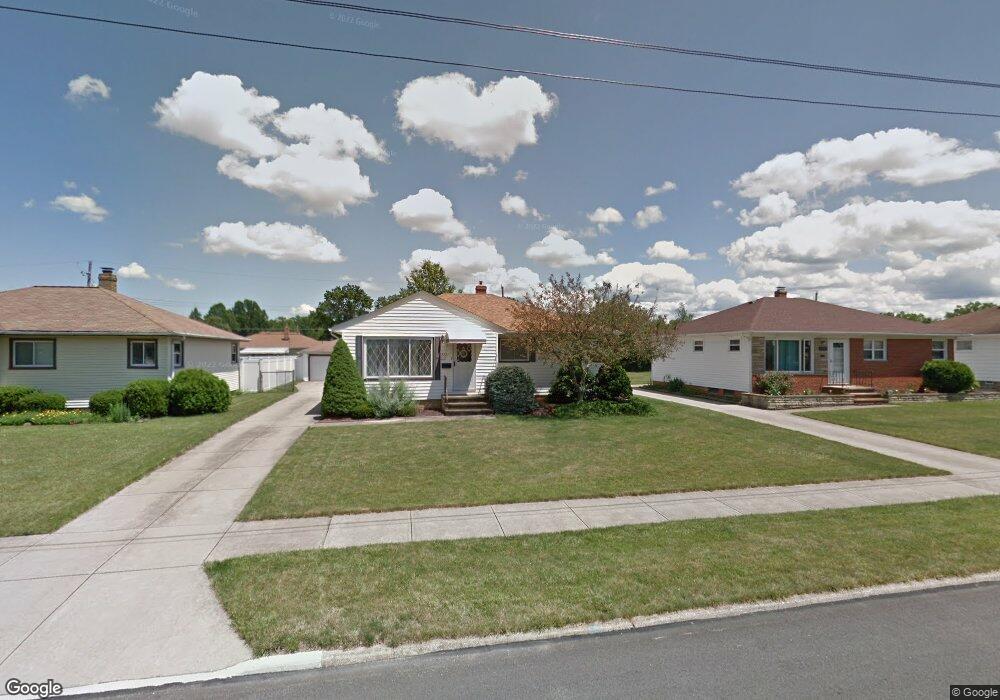
About This Home
This home is located at 7221 Maplewood Rd, Parma, OH 44130 and is currently estimated at $221,706, approximately $181 per square foot. 7221 Maplewood Rd is a home located in Cuyahoga County with nearby schools including Pleasant Valley Elementary School, Greenbriar Middle School, and Valley Forge High School.
Ownership History
Date
Name
Owned For
Owner Type
Purchase Details
Closed on
Jun 17, 1998
Sold by
Walsh Jeffrey and Sweeney Jessica L
Bought by
Cousino Bridget A
Current Estimated Value
Home Financials for this Owner
Home Financials are based on the most recent Mortgage that was taken out on this home.
Original Mortgage
$96,800
Outstanding Balance
$19,500
Interest Rate
7.13%
Mortgage Type
Purchase Money Mortgage
Estimated Equity
$202,206
Purchase Details
Closed on
Aug 17, 1992
Sold by
Brenner Carolyn A
Bought by
Walsh Jeffrey
Purchase Details
Closed on
May 2, 1988
Sold by
Richard G Jones
Bought by
Brenner Carolyn A
Purchase Details
Closed on
Apr 3, 1985
Sold by
Jones Richard G and Jones Mary L
Bought by
Richard G Jones
Purchase Details
Closed on
Jul 30, 1979
Sold by
Barbara A
Bought by
Jones Richard G and Jones Mary L
Purchase Details
Closed on
Jan 1, 1975
Bought by
Barbara A
Create a Home Valuation Report for This Property
The Home Valuation Report is an in-depth analysis detailing your home's value as well as a comparison with similar homes in the area
Home Values in the Area
Average Home Value in this Area
Purchase History
| Date | Buyer | Sale Price | Title Company |
|---|---|---|---|
| Cousino Bridget A | $121,000 | Midland Title Security Inc | |
| Walsh Jeffrey | $96,400 | -- | |
| Brenner Carolyn A | $75,500 | -- | |
| Richard G Jones | -- | -- | |
| Jones Richard G | $65,500 | -- | |
| Barbara A | -- | -- |
Source: Public Records
Mortgage History
| Date | Status | Borrower | Loan Amount |
|---|---|---|---|
| Open | Cousino Bridget A | $96,800 |
Source: Public Records
Tax History
| Year | Tax Paid | Tax Assessment Tax Assessment Total Assessment is a certain percentage of the fair market value that is determined by local assessors to be the total taxable value of land and additions on the property. | Land | Improvement |
|---|---|---|---|---|
| 2024 | $3,968 | $64,890 | $12,460 | $52,430 |
| 2023 | $3,613 | $50,970 | $10,120 | $40,850 |
| 2022 | $3,581 | $50,960 | $10,120 | $40,850 |
| 2021 | $3,684 | $50,960 | $10,120 | $40,850 |
| 2020 | $3,494 | $42,840 | $8,510 | $34,340 |
| 2019 | $3,356 | $122,400 | $24,300 | $98,100 |
| 2018 | $3,266 | $42,840 | $8,510 | $34,340 |
| 2017 | $3,326 | $39,450 | $7,000 | $32,450 |
| 2016 | $3,304 | $39,450 | $7,000 | $32,450 |
| 2015 | $3,145 | $39,450 | $7,000 | $32,450 |
| 2014 | $3,145 | $39,450 | $7,000 | $32,450 |
Source: Public Records
Map
Nearby Homes
- 7209 Maplewood Rd
- 7265 Parma Park Blvd
- 7042 Parma Park Blvd
- 6954 Orchard Blvd
- 7547 N Linden Ln
- 6883 Orchard Blvd
- 6775 Oakwood Rd
- 6751 Oakwood Rd
- 6845 Commonwealth Blvd
- 7706 E Linden Ln
- 11770 Barrington Blvd
- 6693 Parma Park Blvd
- 6640 Pearl Rd Unit 402
- 6919 N Parkway Dr
- 14750 Seneca Trail
- 6624 Big Creek Pkwy
- 7683 Princeton Place
- 7181 York Rd
- 6618 Newbury Ln
- 10410 Terrace Ct
- 7215 Maplewood Rd
- 7227 Maplewood Rd
- 7233 Maplewood Rd
- 7222 Oakwood Rd
- 7228 Oakwood Rd
- 7216 Oakwood Rd
- 7210 Oakwood Rd
- 7234 Oakwood Rd
- 7203 Maplewood Rd
- 7222 Maplewood Rd
- 7239 Maplewood Rd
- 7216 Maplewood Rd
- 7228 Maplewood Rd
- 7210 Maplewood Rd
- 7234 Maplewood Rd
- 7204 Oakwood Rd
- 7240 Oakwood Rd
- 7197 Maplewood Rd
- 7245 Maplewood Rd
- 7204 Maplewood Rd
Your Personal Tour Guide
Ask me questions while you tour the home.