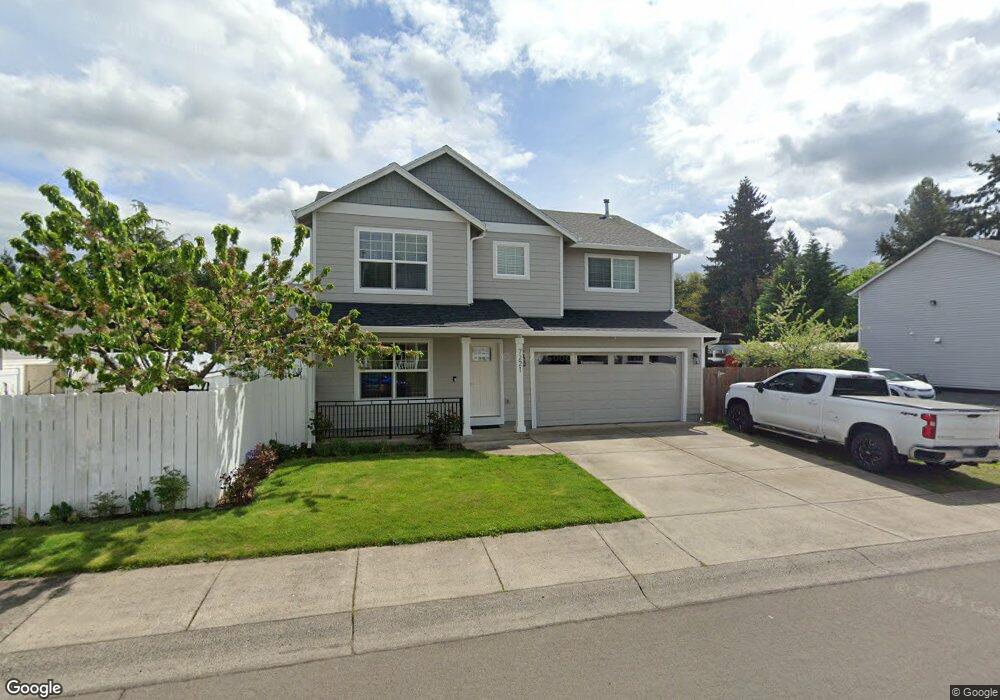
7221 NE 130th Ave Vancouver, WA 98682
Orchards Area NeighborhoodEstimated Value: $501,481 - $540,000
4
Beds
3
Baths
1,914
Sq Ft
$271/Sq Ft
Est. Value
About This Home
This home is located at 7221 NE 130th Ave, Vancouver, WA 98682 and is currently estimated at $518,120, approximately $270 per square foot. 7221 NE 130th Ave is a home located in Clark County with nearby schools including Sifton Elementary School, Covington Middle School, and Heritage High School.
Ownership History
Date
Name
Owned For
Owner Type
Purchase Details
Closed on
Jan 6, 2012
Sold by
The Secretary Of Housing & Urban Develop
Bought by
Constantinov Ivan and Constantinova Maria
Current Estimated Value
Home Financials for this Owner
Home Financials are based on the most recent Mortgage that was taken out on this home.
Original Mortgage
$140,000
Interest Rate
3.83%
Mortgage Type
New Conventional
Purchase Details
Closed on
Nov 3, 2011
Sold by
Pnc Bank National Association
Bought by
The Secretary Of Housing & Urban Develop
Purchase Details
Closed on
Oct 25, 2011
Sold by
Souchinda Vilaphanh and Nouch Sinath
Bought by
Pnc Bank National Association
Purchase Details
Closed on
Oct 30, 2002
Sold by
Imperial Homes Inc
Bought by
Souchinda Vilaphanh and Nouch Sinath
Home Financials for this Owner
Home Financials are based on the most recent Mortgage that was taken out on this home.
Original Mortgage
$126,050
Interest Rate
6.37%
Create a Home Valuation Report for This Property
The Home Valuation Report is an in-depth analysis detailing your home's value as well as a comparison with similar homes in the area
Home Values in the Area
Average Home Value in this Area
Purchase History
| Date | Buyer | Sale Price | Title Company |
|---|---|---|---|
| Constantinov Ivan | -- | First American Title | |
| The Secretary Of Housing & Urban Develop | -- | None Available | |
| Pnc Bank National Association | $193,558 | None Available | |
| Souchinda Vilaphanh | $157,600 | Stewart Title |
Source: Public Records
Mortgage History
| Date | Status | Borrower | Loan Amount |
|---|---|---|---|
| Previous Owner | Constantinov Ivan | $140,000 | |
| Previous Owner | Souchinda Vilaphanh | $126,050 | |
| Closed | Souchinda Vilaphanh | $31,500 |
Source: Public Records
Tax History Compared to Growth
Tax History
| Year | Tax Paid | Tax Assessment Tax Assessment Total Assessment is a certain percentage of the fair market value that is determined by local assessors to be the total taxable value of land and additions on the property. | Land | Improvement |
|---|---|---|---|---|
| 2025 | $4,454 | $450,192 | $169,000 | $281,192 |
| 2024 | $4,521 | $438,491 | $169,000 | $269,491 |
| 2023 | $4,502 | $467,651 | $174,200 | $293,451 |
| 2022 | $4,084 | $458,536 | $174,200 | $284,336 |
| 2021 | $3,812 | $387,342 | $148,200 | $239,142 |
| 2020 | $3,581 | $339,951 | $130,000 | $209,951 |
| 2019 | $3,254 | $320,576 | $123,750 | $196,826 |
| 2018 | $3,449 | $314,372 | $0 | $0 |
| 2017 | $3,249 | $268,751 | $0 | $0 |
| 2016 | $3,056 | $263,826 | $0 | $0 |
| 2015 | $2,958 | $230,969 | $0 | $0 |
| 2014 | -- | $212,789 | $0 | $0 |
| 2013 | -- | $191,044 | $0 | $0 |
Source: Public Records
Map
Nearby Homes
- 13012 NE 76th St
- 6912 NE 131st Ave Unit 10
- 12707 NE 76th St
- 13605 NE 72nd St
- 11025 NE 137th Ave
- 7704 NE 124th Ave
- 0 NE 137th Ave
- 13001 NE 83rd St
- 12801 NE 83rd St
- 8605 NE 136th Ave Unit 135
- 8009 NE 139th Ave
- 13329 NE 83rd Way
- 6406 NE 139th Ct
- 8202 NE 139th Ct
- 13713 NE 64th Cir
- The 2038 Plan at Stone's Throw
- The 1520 Plan at Stone's Throw
- The 2260 Plan at Stone's Throw
- The 1594 Plan at Stone's Throw
- The 1315 Plan at Stone's Throw
- 7223 NE 130th Ave
- 7219 NE 130th Ave
- 7217 NE 130th Ave
- 7215 NE 130th Ave
- 7225 NE 130th Ave
- 12915 NE 73rd St
- 7224 NE 130th Ave
- 7218 NE 130th Ave
- 12918 NE 73rd St
- 7306 NE 131st Ave
- 7216 NE 131st Ave
- 7218 NE 131st Ave
- 12911 NE 73rd St
- 7204 NE 131st Ave
- 7208 NE 131st Ave
- 7214 NE 131st Ave
- 7220 NE 131st Ave
- 7216 NE 130th Ave
- 7222 NE 130th Ave
- 12914 NE 73rd St