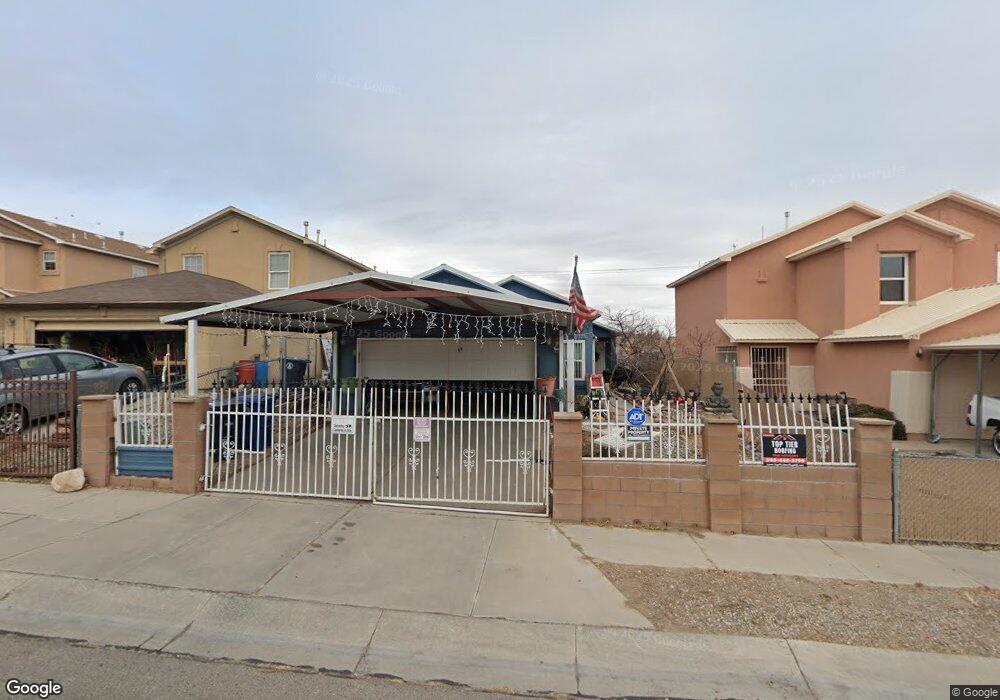
7223 Embarcadera Dr SW Albuquerque, NM 87121
Southwest Heights NeighborhoodEstimated Value: $232,000 - $271,000
3
Beds
2
Baths
1,302
Sq Ft
$197/Sq Ft
Est. Value
About This Home
This home is located at 7223 Embarcadera Dr SW, Albuquerque, NM 87121 and is currently estimated at $256,825, approximately $197 per square foot. 7223 Embarcadera Dr SW is a home located in Bernalillo County with nearby schools including Maryann Binford Elementary School, Truman Middle School, and Harrison Middle School.
Ownership History
Date
Name
Owned For
Owner Type
Purchase Details
Closed on
May 1, 2024
Sold by
Tem-Lopez Alberto
Bought by
Alberto Tem-Lopez Revocable Trust and Tem-Lopez
Current Estimated Value
Purchase Details
Closed on
Nov 23, 2005
Sold by
Hud
Bought by
Lopez Alberto T
Home Financials for this Owner
Home Financials are based on the most recent Mortgage that was taken out on this home.
Original Mortgage
$79,600
Interest Rate
8.5%
Mortgage Type
Purchase Money Mortgage
Purchase Details
Closed on
Jun 15, 2005
Sold by
Countrywide Home Loans Servicing Lp
Bought by
Hud
Purchase Details
Closed on
May 15, 2001
Sold by
Kb Home Sales New Mexico Inc
Bought by
Medina Anthony
Home Financials for this Owner
Home Financials are based on the most recent Mortgage that was taken out on this home.
Original Mortgage
$96,109
Interest Rate
6.99%
Mortgage Type
FHA
Create a Home Valuation Report for This Property
The Home Valuation Report is an in-depth analysis detailing your home's value as well as a comparison with similar homes in the area
Home Values in the Area
Average Home Value in this Area
Purchase History
| Date | Buyer | Sale Price | Title Company |
|---|---|---|---|
| Alberto Tem-Lopez Revocable Trust | -- | None Listed On Document | |
| Lopez Alberto T | -- | Fidelity Natl Title Ins Co | |
| Hud | -- | First American Title Ins Co | |
| Medina Anthony | -- | -- |
Source: Public Records
Mortgage History
| Date | Status | Borrower | Loan Amount |
|---|---|---|---|
| Previous Owner | Lopez Alberto T | $79,600 | |
| Previous Owner | Medina Anthony | $96,109 |
Source: Public Records
Tax History
| Year | Tax Paid | Tax Assessment Tax Assessment Total Assessment is a certain percentage of the fair market value that is determined by local assessors to be the total taxable value of land and additions on the property. | Land | Improvement |
|---|---|---|---|---|
| 2025 | $1,556 | $38,831 | $10,392 | $28,439 |
| 2024 | $1,506 | $37,701 | $10,090 | $27,611 |
| 2023 | $1,479 | $36,603 | $9,796 | $26,807 |
| 2022 | $1,426 | $35,538 | $9,511 | $26,027 |
| 2021 | $1,376 | $34,503 | $9,234 | $25,269 |
| 2020 | $1,351 | $33,498 | $8,965 | $24,533 |
| 2019 | $1,309 | $32,523 | $8,704 | $23,819 |
| 2018 | $1,260 | $32,523 | $8,704 | $23,819 |
| 2017 | $1,304 | $31,576 | $8,451 | $23,125 |
| 2016 | $1,266 | $29,764 | $7,966 | $21,798 |
| 2015 | $29,764 | $29,764 | $7,966 | $21,798 |
| 2014 | $1,272 | $29,964 | $7,966 | $21,998 |
| 2013 | -- | $29,964 | $7,966 | $21,998 |
Source: Public Records
Map
Nearby Homes
- 1405 Secret Valley Dr SW Unit 1
- 1143 Zaragoza St SW
- 0 Sage Rd SW Unit 1085259
- 0 Sage Rd SW Unit 1068436
- 1632 Fox Hill Place SW
- 3350 San Ygnacio Rd SW
- 0 Nwq Unser and Sage SW Unit 1081546
- 0 Nna Unser&tower SW Unit 1081416
- 1112 Angelina Daisy St SW
- 7304 Autumn Sky Rd SW
- 6501 Sage Rd SW
- 7401 Rainmaker Rd SW
- 7823 Desert Springs Ct SW
- 3525 Tower Rd SW
- 1219 82nd St SW
- 7800 Rainwater Rd SW
- 3941 Amalia Rd SW
- 921 Roma Dora Ln
- 1420 Summerfield Place SW
- 7612 Desert Canyon Place SW
- 7227 Embarcadera Dr SW
- 7219 Embarcadera Dr SW
- 7231 Embarcadera Dr SW
- 7215 Embarcadera Dr SW
- 7235 Embarcadera Dr SW
- 7209 Embarcadera Dr SW
- 1315 Questa Ct SW
- 1315 Questa Ct SW Unit 2
- 7239 Embarcadera Dr SW
- 7212 Embarcadera Dr SW
- 7205 Embarcadera Dr SW
- 1317 Questa Ct SW
- 7208 Embarcadera Dr SW
- 7243 Embarcadera Dr SW
- 1319 Questa Ct SW
- 1316 Tres Ritos St SW
- 7247 Embarcadera Dr SW
- 1301 Ojo Feliz St SW
- 1309 Ojo Feliz St SW
- 1305 Ojo Feliz St SW
Your Personal Tour Guide
Ask me questions while you tour the home.