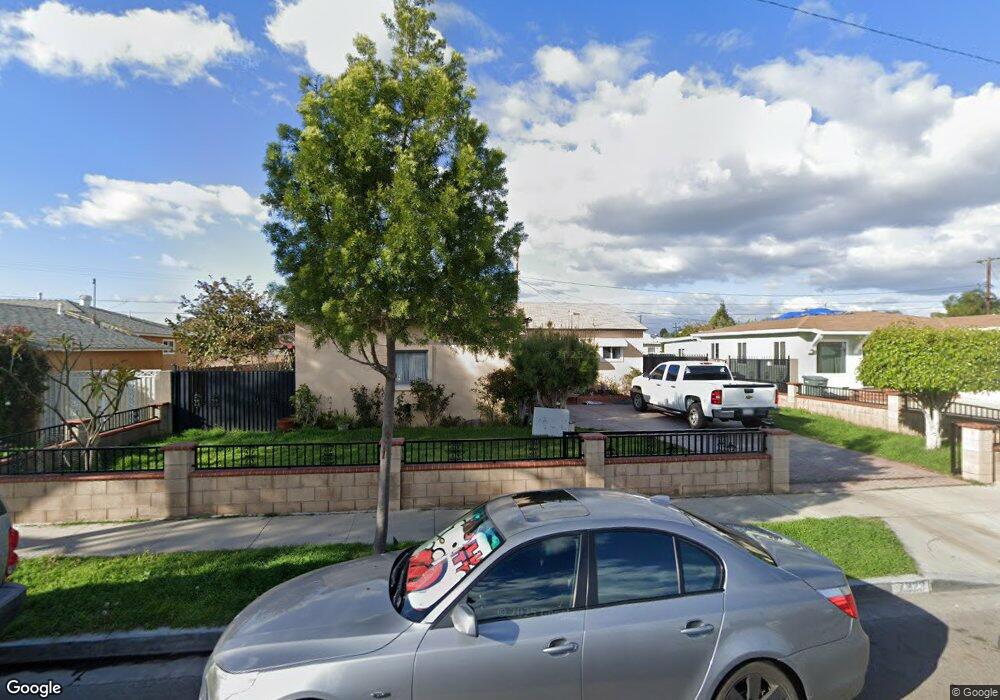
7223 Scales Way Buena Park, CA 90621
Estimated Value: $686,000 - $878,559
3
Beds
3
Baths
1,424
Sq Ft
$570/Sq Ft
Est. Value
About This Home
This home is located at 7223 Scales Way, Buena Park, CA 90621 and is currently estimated at $811,140, approximately $569 per square foot. 7223 Scales Way is a home located in Orange County with nearby schools including Carl E. Gilbert Elementary School, Buena Park Junior High School, and Buena Park High School.
Ownership History
Date
Name
Owned For
Owner Type
Purchase Details
Closed on
Nov 5, 2018
Sold by
Diaz Enedina
Bought by
Diaz Enedina and The Enedina Diaz Living Trust
Current Estimated Value
Purchase Details
Closed on
Dec 17, 2001
Sold by
Diaz Uriel
Bought by
Diaz Uriel C and Diaz Enedina
Home Financials for this Owner
Home Financials are based on the most recent Mortgage that was taken out on this home.
Original Mortgage
$136,500
Outstanding Balance
$53,100
Interest Rate
6.51%
Estimated Equity
$758,040
Purchase Details
Closed on
Sep 2, 1998
Sold by
Bousquet David L and Bousquet Virginia M
Bought by
Diaz Uriel C and Diaz Enedina Diaz
Home Financials for this Owner
Home Financials are based on the most recent Mortgage that was taken out on this home.
Original Mortgage
$137,015
Interest Rate
6.88%
Mortgage Type
FHA
Create a Home Valuation Report for This Property
The Home Valuation Report is an in-depth analysis detailing your home's value as well as a comparison with similar homes in the area
Home Values in the Area
Average Home Value in this Area
Purchase History
| Date | Buyer | Sale Price | Title Company |
|---|---|---|---|
| Diaz Enedina | -- | None Available | |
| Diaz Uriel C | -- | American Title Co | |
| Diaz Uriel C | $144,000 | Commonwealth Land Title |
Source: Public Records
Mortgage History
| Date | Status | Borrower | Loan Amount |
|---|---|---|---|
| Open | Diaz Uriel C | $136,500 | |
| Closed | Diaz Uriel C | $137,015 |
Source: Public Records
Tax History Compared to Growth
Tax History
| Year | Tax Paid | Tax Assessment Tax Assessment Total Assessment is a certain percentage of the fair market value that is determined by local assessors to be the total taxable value of land and additions on the property. | Land | Improvement |
|---|---|---|---|---|
| 2025 | $3,273 | $279,000 | $162,416 | $116,584 |
| 2024 | $3,273 | $273,530 | $159,231 | $114,299 |
| 2023 | $3,202 | $268,167 | $156,109 | $112,058 |
| 2022 | $3,147 | $262,909 | $153,048 | $109,861 |
| 2021 | $3,122 | $257,754 | $150,047 | $107,707 |
| 2020 | $3,083 | $255,112 | $148,509 | $106,603 |
| 2019 | $3,012 | $250,110 | $145,597 | $104,513 |
| 2018 | $2,954 | $245,206 | $142,742 | $102,464 |
| 2017 | $2,911 | $240,399 | $139,944 | $100,455 |
| 2016 | $2,853 | $235,686 | $137,200 | $98,486 |
| 2015 | $2,732 | $232,146 | $135,139 | $97,007 |
| 2014 | $2,720 | $227,599 | $132,492 | $95,107 |
Source: Public Records
Map
Nearby Homes
- 7261 9th St
- 7051 9th St
- 7465 Western Bay Dr
- 6482 Western Ave
- 6493 Kingman Ave
- 6411 Western Ave
- 7579 Melrose St
- 7142 Orangethorpe Ave Unit 8D
- 7515 8th St
- 7692 9th St Unit 117
- 7692 9th St Unit 116
- 7692 9th St Unit 112
- 7692 9th St Unit 115
- 7791 Melrose St
- 6861 Frost Cir
- 7451 Western Ave
- 6296 Beach Blvd
- 7531 Knott Ave
- 7561 El Campo Cir
- 6302 Homewood Ave
- 7229 Scales Way
- 7217 Scales Way
- 7192 Yucca St
- 7202 Yucca St
- 7235 Scales Way
- 7211 Scales Way
- 7182 Yucca St
- 7224 Scales Way
- 7222 Yucca St
- 7230 Scales Way
- 7218 Scales Way
- 7205 Scales Way
- 7162 Yucca St
- 7236 Scales Way
- 7241 Scales Way
- 7212 Scales Way
- 7232 Yucca St
- 7138 Scales Way
- 7242 Scales Way
- 7206 Scales Way