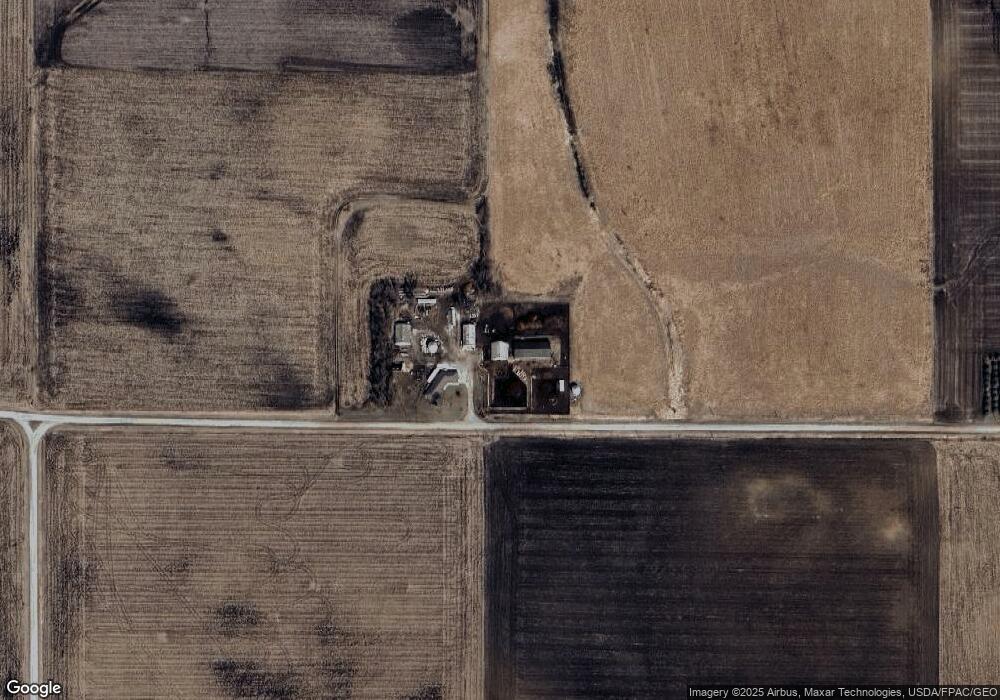
72235 113th St Zearing, IA 50278
Estimated Value: $451,000 - $497,111
5
Beds
3
Baths
2,051
Sq Ft
$231/Sq Ft
Est. Value
About This Home
This home is located at 72235 113th St, Zearing, IA 50278 and is currently estimated at $474,056, approximately $231 per square foot. 72235 113th St is a home located in Story County with nearby schools including Colo-NESCO Senior High School.
Ownership History
Date
Name
Owned For
Owner Type
Purchase Details
Closed on
Jul 31, 2009
Sold by
Roche Francis J
Bought by
Perisho Jessica L
Current Estimated Value
Purchase Details
Closed on
Aug 6, 2005
Sold by
Perisho Jeffrey B and Perisho Laura J
Bought by
Perisho Blake B
Home Financials for this Owner
Home Financials are based on the most recent Mortgage that was taken out on this home.
Original Mortgage
$70,000
Interest Rate
5.69%
Mortgage Type
Future Advance Clause Open End Mortgage
Create a Home Valuation Report for This Property
The Home Valuation Report is an in-depth analysis detailing your home's value as well as a comparison with similar homes in the area
Home Values in the Area
Average Home Value in this Area
Purchase History
| Date | Buyer | Sale Price | Title Company |
|---|---|---|---|
| Perisho Jessica L | $35,000 | -- | |
| Perisho Blake B | $80,000 | -- |
Source: Public Records
Mortgage History
| Date | Status | Borrower | Loan Amount |
|---|---|---|---|
| Previous Owner | Perisho Blake B | $70,000 |
Source: Public Records
Tax History Compared to Growth
Tax History
| Year | Tax Paid | Tax Assessment Tax Assessment Total Assessment is a certain percentage of the fair market value that is determined by local assessors to be the total taxable value of land and additions on the property. | Land | Improvement |
|---|---|---|---|---|
| 2025 | $3,968 | $347,400 | $5,800 | $341,600 |
| 2024 | $3,832 | $328,500 | $4,300 | $324,200 |
| 2023 | $3,452 | $328,500 | $4,300 | $324,200 |
| 2022 | $3,280 | $248,500 | $3,400 | $245,100 |
| 2021 | $3,472 | $248,500 | $3,400 | $245,100 |
| 2020 | $3,406 | $247,800 | $3,100 | $244,700 |
| 2019 | $3,406 | $247,800 | $3,100 | $244,700 |
| 2018 | $2,854 | $236,500 | $4,100 | $232,400 |
| 2017 | $2,854 | $236,500 | $4,100 | $232,400 |
| 2016 | $3,138 | $225,000 | $4,700 | $220,300 |
| 2015 | $3,138 | $225,000 | $4,700 | $220,300 |
| 2014 | $3,272 | $231,000 | $6,600 | $224,400 |
Source: Public Records
Map
Nearby Homes