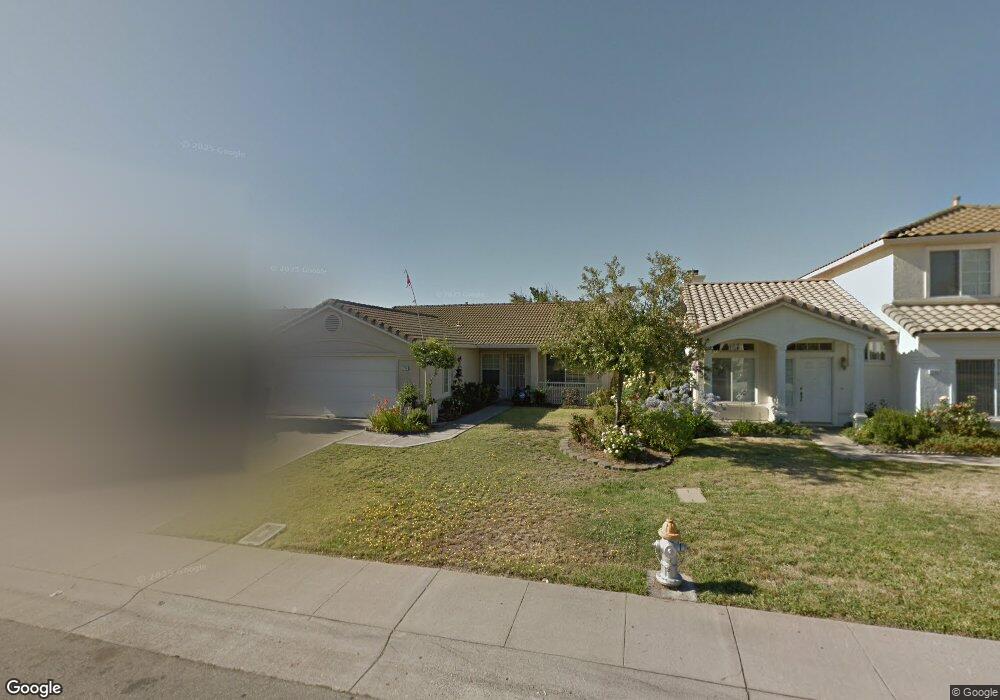
7224 Alpine Frost Dr Sacramento, CA 95823
North Laguna NeighborhoodEstimated Value: $339,000 - $432,000
2
Beds
2
Baths
1,154
Sq Ft
$347/Sq Ft
Est. Value
About This Home
This home is located at 7224 Alpine Frost Dr, Sacramento, CA 95823 and is currently estimated at $400,612, approximately $347 per square foot. 7224 Alpine Frost Dr is a home located in Sacramento County with nearby schools including Herman Leimbach Elementary School, Samuel Jackman Middle School, and Valley High School.
Ownership History
Date
Name
Owned For
Owner Type
Purchase Details
Closed on
Mar 22, 2000
Sold by
Sweigert Jack
Bought by
Sewak Ram Kumar and Sewak Suruj K
Current Estimated Value
Home Financials for this Owner
Home Financials are based on the most recent Mortgage that was taken out on this home.
Original Mortgage
$40,000
Interest Rate
8.34%
Purchase Details
Closed on
Mar 3, 1995
Sold by
J & L Properties
Bought by
Sweigart Jack T
Home Financials for this Owner
Home Financials are based on the most recent Mortgage that was taken out on this home.
Original Mortgage
$83,250
Interest Rate
5.75%
Purchase Details
Closed on
Mar 2, 1995
Sold by
Sweigart Victoria
Bought by
Sweigart Jack T
Home Financials for this Owner
Home Financials are based on the most recent Mortgage that was taken out on this home.
Original Mortgage
$83,250
Interest Rate
5.75%
Create a Home Valuation Report for This Property
The Home Valuation Report is an in-depth analysis detailing your home's value as well as a comparison with similar homes in the area
Home Values in the Area
Average Home Value in this Area
Purchase History
| Date | Buyer | Sale Price | Title Company |
|---|---|---|---|
| Sewak Ram Kumar | $120,000 | Placer Title Company | |
| Sweigart Jack T | -- | Placer Title Company | |
| Sweigart Jack T | -- | Founders Title Company | |
| Sweigart Jack T | -- | Founders Title Company |
Source: Public Records
Mortgage History
| Date | Status | Borrower | Loan Amount |
|---|---|---|---|
| Closed | Sweigart Jack T | $40,000 | |
| Previous Owner | Sweigart Jack T | $83,250 |
Source: Public Records
Tax History Compared to Growth
Tax History
| Year | Tax Paid | Tax Assessment Tax Assessment Total Assessment is a certain percentage of the fair market value that is determined by local assessors to be the total taxable value of land and additions on the property. | Land | Improvement |
|---|---|---|---|---|
| 2025 | $2,177 | $184,409 | $46,095 | $138,314 |
| 2024 | $2,177 | $180,794 | $45,192 | $135,602 |
| 2023 | $2,115 | $177,250 | $44,306 | $132,944 |
| 2022 | $2,091 | $173,776 | $43,438 | $130,338 |
| 2021 | $2,055 | $170,370 | $42,587 | $127,783 |
| 2020 | $2,022 | $168,624 | $42,151 | $126,473 |
| 2019 | $1,984 | $165,319 | $41,325 | $123,994 |
| 2018 | $1,930 | $162,078 | $40,515 | $121,563 |
| 2017 | $1,889 | $158,901 | $39,721 | $119,180 |
| 2016 | $1,831 | $155,787 | $38,943 | $116,844 |
| 2015 | $1,792 | $153,448 | $38,359 | $115,089 |
| 2014 | $1,776 | $150,443 | $37,608 | $112,835 |
Source: Public Records
Map
Nearby Homes
- 8115 Gandy Dancer Way
- 8210 Gandy Dancer Way
- 57 Kennelford Cir
- 8045 Arroyo Vista Dr
- 8095 E Stockton Blvd
- 8216 Center Pkwy
- 44 Hallowell Ct
- 62 Hallowell Ct
- 39 Hallowell Ct
- 8220 Center Pkwy Unit 38
- 8228 Center Pkwy Unit 46
- 45 Hallowell Ct
- 51 Hallowell Ct
- 57 Hallowell Ct
- 63 Hallowell Ct
- 0 Rangeview Ln
- 8200 Center Pkwy Unit 9
- 8244 Center Pkwy Unit 65
- 6330 Valley hi Dr
- 8252 Center Pkwy
- 7220 Alpine Frost Dr
- 7228 Alpine Frost Dr
- 7173 Surreywood Way
- 7216 Alpine Frost Dr
- 7232 Alpine Frost Dr
- 7177 Surreywood Way
- 7169 Surreywood Way
- 7181 Surreywood Way
- 7165 Surreywood Way
- 7225 Alpine Frost Dr
- 7229 Alpine Frost Dr
- 7236 Alpine Frost Dr
- 7212 Alpine Frost Dr
- 7221 Alpine Frost Dr
- 7231 Alpine Frost Dr
- 7185 Surreywood Way
- 7161 Surreywood Way
- 7217 Alpine Frost Dr
- 7240 Alpine Frost Dr
- 7189 Surreywood Way