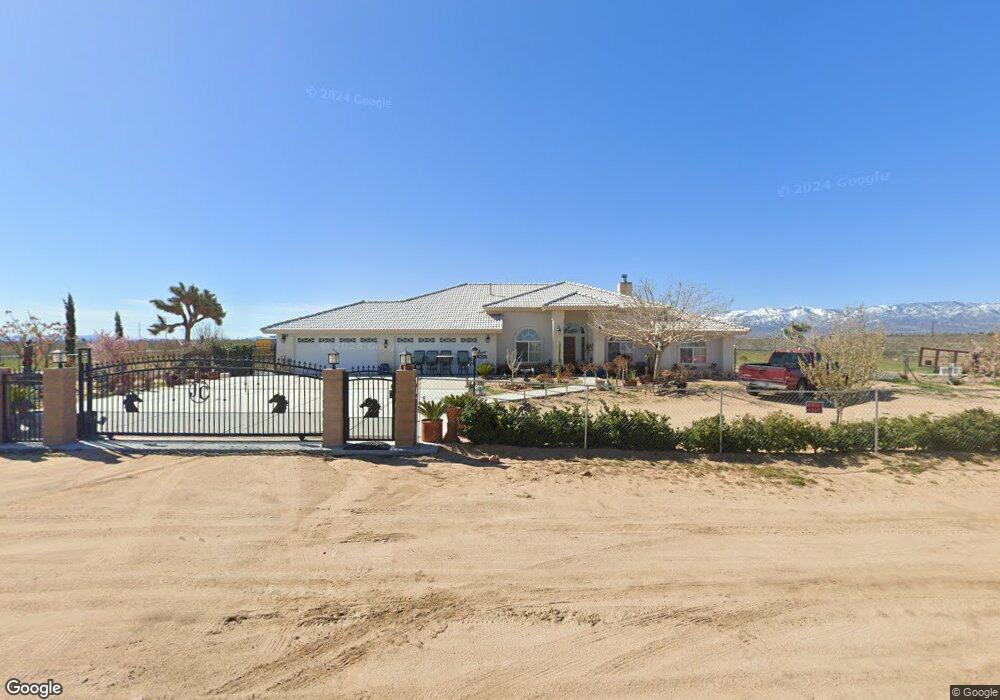
7225 Begonia Rd Phelan, CA 92371
Estimated Value: $523,000 - $552,000
4
Beds
3
Baths
2,564
Sq Ft
$210/Sq Ft
Est. Value
About This Home
This home is located at 7225 Begonia Rd, Phelan, CA 92371 and is currently estimated at $538,359, approximately $209 per square foot. 7225 Begonia Rd is a home located in San Bernardino County with nearby schools including El Mirage School and Adelanto High School.
Ownership History
Date
Name
Owned For
Owner Type
Purchase Details
Closed on
Oct 5, 2021
Sold by
Carlos Sanchez Juan
Bought by
Separ 2021 Juan Carlos Sanchez
Current Estimated Value
Purchase Details
Closed on
Oct 23, 2012
Sold by
Rozak Development Llc
Bought by
Sanchez Juan C
Home Financials for this Owner
Home Financials are based on the most recent Mortgage that was taken out on this home.
Original Mortgage
$120,250
Interest Rate
3.36%
Mortgage Type
New Conventional
Purchase Details
Closed on
Aug 1, 2012
Sold by
Lewis Leonard R
Bought by
Rozak Development Llc
Purchase Details
Closed on
Dec 7, 2007
Sold by
Ramirez Antonio
Bought by
Lewis Leonard R and Lewis Sylvia
Home Financials for this Owner
Home Financials are based on the most recent Mortgage that was taken out on this home.
Original Mortgage
$345,000
Interest Rate
6.09%
Mortgage Type
Purchase Money Mortgage
Purchase Details
Closed on
Nov 21, 2003
Sold by
Brock Donald P
Bought by
Ramirez Antonio and Ramirez Charlotte L
Create a Home Valuation Report for This Property
The Home Valuation Report is an in-depth analysis detailing your home's value as well as a comparison with similar homes in the area
Purchase History
| Date | Buyer | Sale Price | Title Company |
|---|---|---|---|
| Separ 2021 Juan Carlos Sanchez | -- | None Listed On Document | |
| Sanchez Juan C | $185,000 | Chicago Title | |
| Rozak Development Llc | $138,500 | None Available | |
| Lewis Leonard R | $345,000 | Orange Coast Title | |
| Ramirez Antonio | $22,000 | Chicago Title Co |
Source: Public Records
Mortgage History
| Date | Status | Borrower | Loan Amount |
|---|---|---|---|
| Previous Owner | Sanchez Juan C | $120,250 | |
| Previous Owner | Lewis Leonard R | $345,000 |
Source: Public Records
Tax History
| Year | Tax Paid | Tax Assessment Tax Assessment Total Assessment is a certain percentage of the fair market value that is determined by local assessors to be the total taxable value of land and additions on the property. | Land | Improvement |
|---|---|---|---|---|
| 2025 | $2,890 | $227,814 | $19,703 | $208,111 |
| 2024 | $2,710 | $223,347 | $19,317 | $204,030 |
| 2023 | $2,681 | $218,967 | $18,938 | $200,029 |
| 2022 | $2,705 | $214,674 | $18,567 | $196,107 |
| 2021 | $2,845 | $210,465 | $18,203 | $192,262 |
| 2020 | $2,793 | $208,307 | $18,016 | $190,291 |
| 2019 | $2,776 | $204,223 | $17,663 | $186,560 |
| 2018 | $2,647 | $200,219 | $17,317 | $182,902 |
| 2017 | $2,572 | $196,293 | $16,977 | $179,316 |
| 2016 | $2,541 | $192,444 | $16,644 | $175,800 |
| 2015 | $2,452 | $189,553 | $16,394 | $173,159 |
| 2014 | $2,432 | $185,840 | $16,073 | $169,767 |
Source: Public Records
Map
Nearby Homes
- 7327 South St
- 14460 Nevada Rd
- 6833 South St
- 6800 South St
- 6692 Palmdale Rd
- 0 Marrakesh Ave Unit 4
- 0 Bonanza Rd
- 6677 Maricopa Rd
- 0 Highway 18
- 0 Luna Rd Unit OC26023858
- 6450 Maricopa Rd
- 0 Palmdale Rd Unit HD24170031
- 0 Palmdale Rd Unit TR25005076
- 0 Palmdale Rd Unit HD25239596
- 0 Mojave Rd Unit HD22064359
- 6288 Maricopa Rd
- 0 Lupin Rd
- 5900 Palmdale Rd
- 0 South St Unit CV25070735
- 0 South St Unit HD25253415
- 7252 Begonia Rd
- 7274 Begonia Rd
- 7219 Camellia Rd
- 14295 Nevada Rd
- 14321 Lessing Rd
- 7122 Begonia Rd
- 14381 Lessing Rd
- 0 Camellia Rd Unit IV14108481
- 0 Camellia Rd Unit IV17149205
- 0 Camellia Unit IV16176883
- 0 Camellia Rd Unit CV20143380
- 0 Camellia Rd Unit IG19259024
- 0 Camellia Rd Unit 469208
- 0 Camellia Rd Unit CV19213807
- 0 Camellia Rd Unit 514556
- 0 Camellia Rd Unit 440042
- 0 Camellia Rd Unit 487413
- 0 Camellia Rd Unit 509354
- 0 Camellia Rd Unit WS18275045
- 7220 Camellia Rd
Your Personal Tour Guide
Ask me questions while you tour the home.