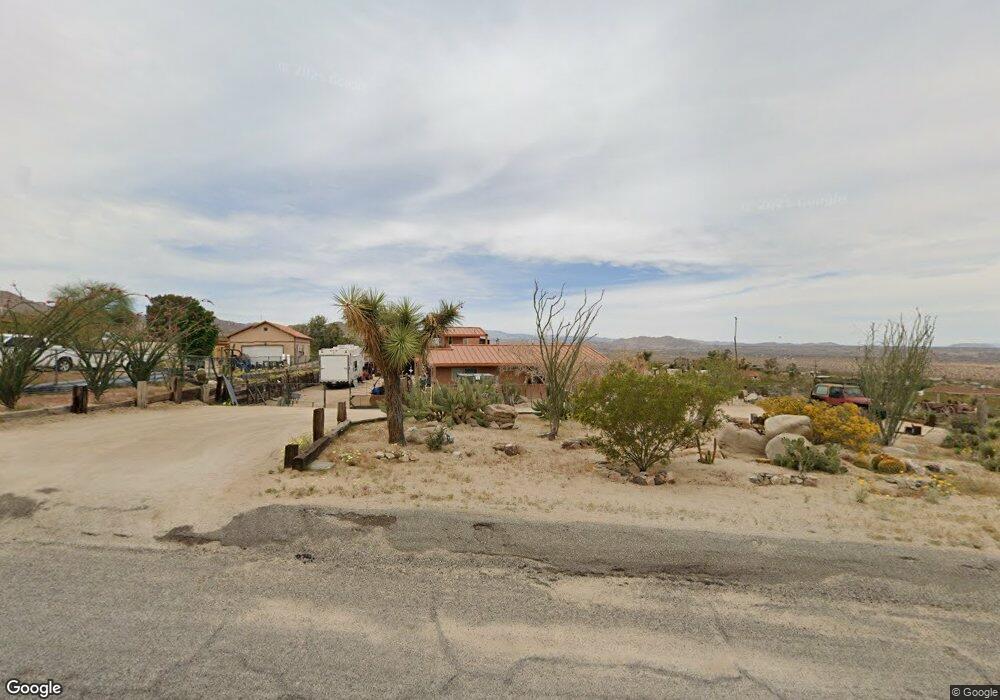
7226 Mount Shasta Ave Joshua Tree, CA 92252
Estimated Value: $320,332 - $635,000
2
Beds
2
Baths
1,558
Sq Ft
$305/Sq Ft
Est. Value
About This Home
This home is located at 7226 Mount Shasta Ave, Joshua Tree, CA 92252 and is currently estimated at $474,833, approximately $304 per square foot. 7226 Mount Shasta Ave is a home located in San Bernardino County with nearby schools including Oasis Elementary School, Twentynine Palms Junior High School, and Twentynine Palms High School.
Ownership History
Date
Name
Owned For
Owner Type
Purchase Details
Closed on
Jun 26, 2012
Sold by
Barber Frank Carl and Barber Helen Patricia
Bought by
Barber Frank C and Barber Helen P
Current Estimated Value
Purchase Details
Closed on
Aug 25, 2003
Sold by
Barber Frank Carl and Barber Helen Patricia
Bought by
Barber Frank Carl and Barber Helen Patricia
Home Financials for this Owner
Home Financials are based on the most recent Mortgage that was taken out on this home.
Original Mortgage
$83,000
Interest Rate
5.6%
Mortgage Type
Purchase Money Mortgage
Purchase Details
Closed on
Nov 10, 1999
Sold by
Luckman Charles
Bought by
Luckman Denise
Purchase Details
Closed on
Apr 25, 1999
Sold by
Barber Katherine M Tr
Bought by
Barber Frank C and Barber Helen Patricia
Create a Home Valuation Report for This Property
The Home Valuation Report is an in-depth analysis detailing your home's value as well as a comparison with similar homes in the area
Home Values in the Area
Average Home Value in this Area
Purchase History
| Date | Buyer | Sale Price | Title Company |
|---|---|---|---|
| Barber Frank C | -- | None Available | |
| Barber Frank Carl | -- | Chicago Title Co | |
| Luckman Denise | -- | First American Title Ins Co | |
| Barber Frank C | -- | First American Title |
Source: Public Records
Mortgage History
| Date | Status | Borrower | Loan Amount |
|---|---|---|---|
| Closed | Barber Frank Carl | $83,000 |
Source: Public Records
Tax History Compared to Growth
Tax History
| Year | Tax Paid | Tax Assessment Tax Assessment Total Assessment is a certain percentage of the fair market value that is determined by local assessors to be the total taxable value of land and additions on the property. | Land | Improvement |
|---|---|---|---|---|
| 2025 | $1,233 | $89,633 | $3,745 | $85,888 |
| 2024 | $1,233 | $87,876 | $3,672 | $84,204 |
| 2023 | $1,209 | $86,153 | $3,600 | $82,553 |
| 2022 | $1,184 | $84,463 | $3,529 | $80,934 |
| 2021 | $1,169 | $82,807 | $3,460 | $79,347 |
| 2020 | $1,157 | $81,958 | $3,425 | $78,533 |
| 2019 | $1,214 | $80,351 | $3,358 | $76,993 |
| 2018 | $1,046 | $78,775 | $3,292 | $75,483 |
| 2017 | $1,035 | $77,230 | $3,227 | $74,003 |
| 2016 | $1,017 | $75,716 | $3,164 | $72,552 |
| 2015 | $977 | $74,578 | $3,116 | $71,462 |
| 2014 | $1,002 | $73,117 | $3,055 | $70,062 |
Source: Public Records
Map
Nearby Homes
- 7192 Mount Shasta Ave
- 7215 Mt Lassen Ave
- 7084 Mount Lassen Ave
- 66075 Foothill Dr
- 7030 Mile Square Rd
- 66154 Sullivan Rd
- 66425 Foothill Dr
- 6655 Cascade Rd
- 64755 Foothill Dr
- 66058 Foothill Dr
- 64647 Foothill Dr
- 7190 Lawrence Ave
- 0 Cactus Dr
- 1.25 Acres On Hwy 62 Near Sunfair Rd
- 6658 El Rey Ave
- 0 Fran Lou Ln Unit HD24242493
- 1.25 Acres Hwy 62 Near Sunfair Rd
- 5 Acres Near Hwy 62 and Sunfair Rd
- 5 Acres On Hwy 62 Near Sunfair Rd
- 1142 Fran Lou Ln
- 7236 Mount Shasta Ave
- 7365 Mount Lassen Ave
- 7285 Mt Lassen Ave
- 7285 Mount Lassen Ave
- 7186 Mount Shasta Ave
- 7187 Mount Shasta Ave
- 7284 Mount Shasta Ave
- 7170 Mount Shasta Ave
- 7216 Mount Lassen Ave
- 7137 Mount Lassen Ave
- 65865 Foothill Dr
- 7121 Mount Shasta Ave
- 7168 Mount Lassen Ave
- 7263 Mount Shasta Ave
- 7220 Mt Lassen Ave
- 7119 Mount Shasta Ave
- 7117 Mount Lassen Ave
- 7284 Mount Lassen Ave
- 7138 Mount Lassen Ave
- 65756 Base Line