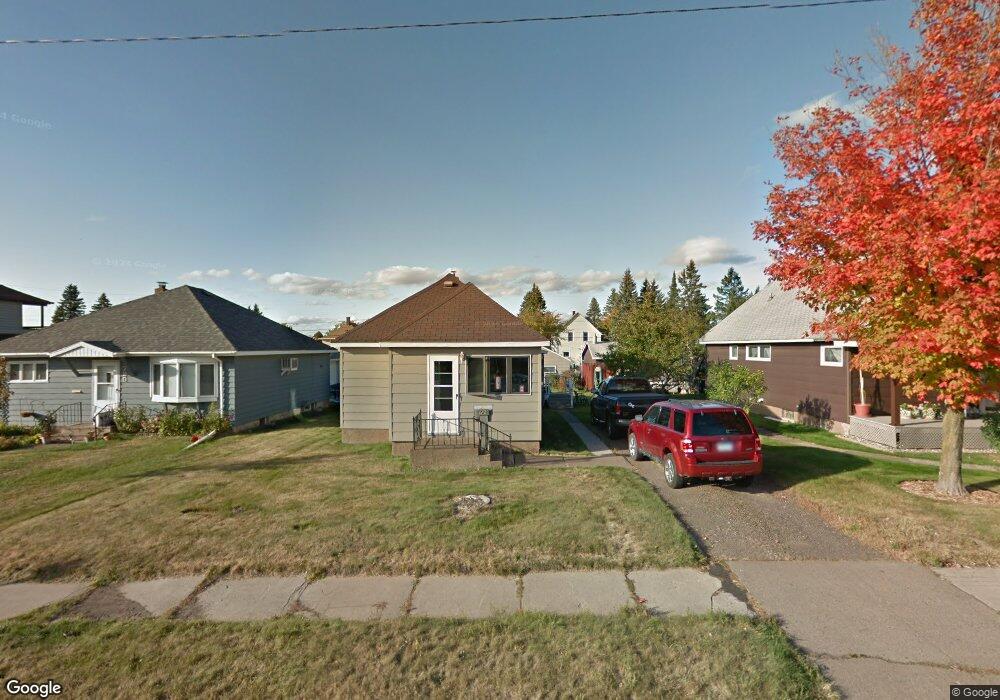
723 2nd St Duluth, MN 55810
Estimated Value: $183,000 - $232,000
2
Beds
1
Bath
880
Sq Ft
$230/Sq Ft
Est. Value
About This Home
This home is located at 723 2nd St, Duluth, MN 55810 and is currently estimated at $202,157, approximately $229 per square foot. 723 2nd St is a home located in St. Louis County with nearby schools including Bay View Elementary School, Jedlicka Middle School, and Proctor Senior High School.
Ownership History
Date
Name
Owned For
Owner Type
Purchase Details
Closed on
May 23, 2022
Sold by
Morin Daniel J and Morin Brooke N
Bought by
Ms Enterprises Llc
Current Estimated Value
Purchase Details
Closed on
Mar 26, 2021
Sold by
Strongitharm Michael J and Strongitharm Mary E
Bought by
Morin Daniel J and Strom Brooke N
Create a Home Valuation Report for This Property
The Home Valuation Report is an in-depth analysis detailing your home's value as well as a comparison with similar homes in the area
Home Values in the Area
Average Home Value in this Area
Purchase History
| Date | Buyer | Sale Price | Title Company |
|---|---|---|---|
| Ms Enterprises Llc | $500 | Olson Law Pllc | |
| Morin Daniel J | $68,000 | None Available |
Source: Public Records
Tax History
| Year | Tax Paid | Tax Assessment Tax Assessment Total Assessment is a certain percentage of the fair market value that is determined by local assessors to be the total taxable value of land and additions on the property. | Land | Improvement |
|---|---|---|---|---|
| 2024 | $2,822 | $167,400 | $6,200 | $161,200 |
| 2023 | $2,822 | $144,900 | $4,700 | $140,200 |
| 2022 | $2,084 | $128,500 | $4,700 | $123,800 |
| 2021 | $2,030 | $122,900 | $4,400 | $118,500 |
| 2020 | $1,920 | $120,400 | $4,300 | $116,100 |
| 2019 | $1,902 | $112,200 | $4,300 | $107,900 |
| 2018 | $1,940 | $112,800 | $23,200 | $89,600 |
| 2017 | $1,788 | $112,700 | $23,100 | $89,600 |
| 2016 | $1,690 | $107,000 | $23,100 | $83,900 |
| 2015 | $1,326 | $102,200 | $22,000 | $80,200 |
| 2014 | $1,326 | $88,600 | $24,200 | $64,400 |
Source: Public Records
Map
Nearby Homes
- 804 Lupine Dr
- 1086 U S Highway 2
- 502 3rd Ave
- 505 Summit Ave
- 121 Oak St
- 8 4th St
- TBD Meadow St
- 63 S Elder Dr
- 2 Dewberry Ln
- 421 Saint Louis River Rd
- XX10 Lavaque Rd
- XX40 Lavaque Rd
- 5105 Sheridan Rd
- 4929 Wild Rose Tr
- 4929 Wildrose Trail
- 51xxx Wagner Rd
- 322 N 80th Ave W
- 5493 Old Highway 61
- 8313 Eric Shaffer Way
- 8602 Maynard Place
Your Personal Tour Guide
Ask me questions while you tour the home.