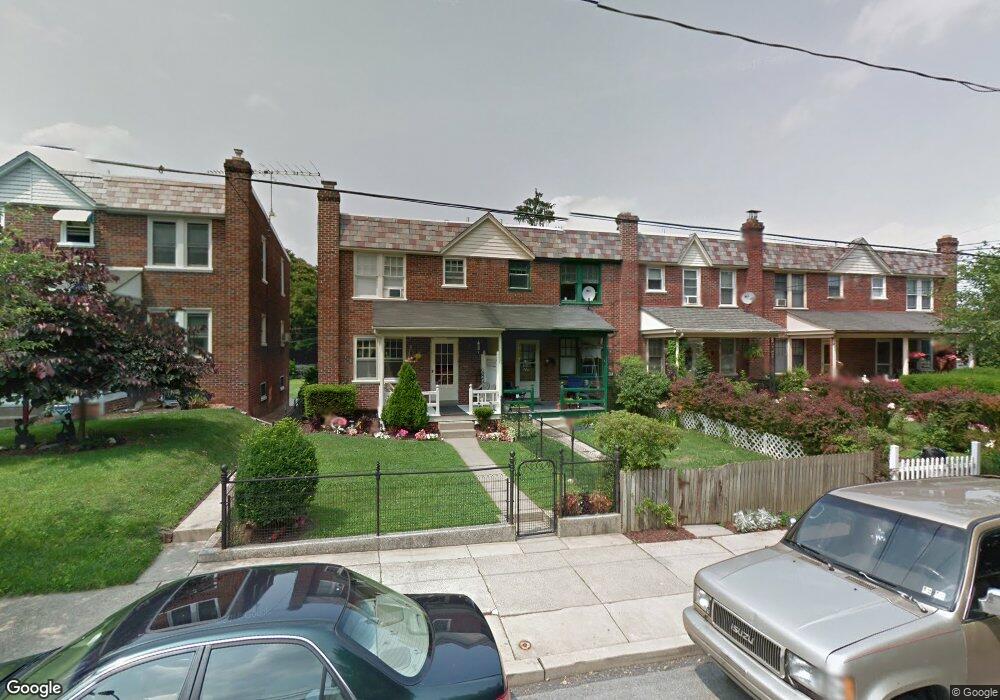
723 2nd St Lancaster, PA 17603
West End NeighborhoodEstimated Value: $204,000 - $215,000
3
Beds
1
Bath
1,140
Sq Ft
$182/Sq Ft
Est. Value
About This Home
This home is located at 723 2nd St, Lancaster, PA 17603 and is currently estimated at $207,569, approximately $182 per square foot. 723 2nd St is a home located in Lancaster County with nearby schools including Smith-Wade-El Elementary School, Wheatland Middle School, and McCaskey High School.
Ownership History
Date
Name
Owned For
Owner Type
Purchase Details
Closed on
Nov 20, 2024
Sold by
Gibson James P and Gibson Kimberly S
Bought by
Gibson Kimberly S
Current Estimated Value
Purchase Details
Closed on
Dec 18, 2001
Sold by
Gibson James P and Gibson Kimberly S
Bought by
Gibson James P and Gibson Kimberly S
Home Financials for this Owner
Home Financials are based on the most recent Mortgage that was taken out on this home.
Original Mortgage
$66,350
Interest Rate
6.54%
Create a Home Valuation Report for This Property
The Home Valuation Report is an in-depth analysis detailing your home's value as well as a comparison with similar homes in the area
Home Values in the Area
Average Home Value in this Area
Purchase History
| Date | Buyer | Sale Price | Title Company |
|---|---|---|---|
| Gibson Kimberly S | -- | None Listed On Document | |
| Gibson Kimberly S | -- | None Listed On Document | |
| Gibson James P | -- | Lawyers Title Ins Corp |
Source: Public Records
Mortgage History
| Date | Status | Borrower | Loan Amount |
|---|---|---|---|
| Previous Owner | Gibson James P | $66,350 |
Source: Public Records
Tax History Compared to Growth
Tax History
| Year | Tax Paid | Tax Assessment Tax Assessment Total Assessment is a certain percentage of the fair market value that is determined by local assessors to be the total taxable value of land and additions on the property. | Land | Improvement |
|---|---|---|---|---|
| 2025 | $3,110 | $78,600 | $20,400 | $58,200 |
| 2024 | $3,110 | $78,600 | $20,400 | $58,200 |
| 2023 | $3,058 | $78,600 | $20,400 | $58,200 |
| 2022 | $2,931 | $78,600 | $20,400 | $58,200 |
| 2021 | $2,868 | $78,600 | $20,400 | $58,200 |
| 2020 | $2,868 | $78,600 | $20,400 | $58,200 |
| 2019 | $2,825 | $78,600 | $20,400 | $58,200 |
| 2018 | $1,676 | $78,600 | $20,400 | $58,200 |
| 2017 | $3,344 | $72,800 | $23,600 | $49,200 |
| 2016 | $3,313 | $72,800 | $23,600 | $49,200 |
| 2015 | $1,293 | $72,800 | $23,600 | $49,200 |
| 2014 | $2,892 | $72,800 | $23,600 | $49,200 |
Source: Public Records
Map
Nearby Homes