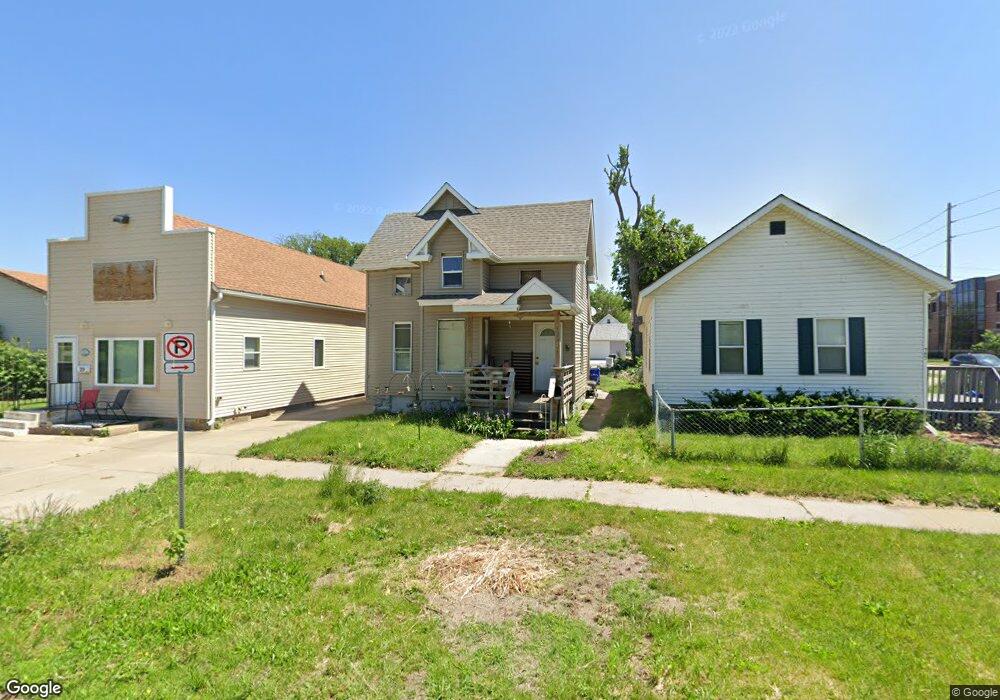
723 3rd St SW Cedar Rapids, IA 52404
Taylor NeighborhoodEstimated Value: $131,000 - $162,000
2
Beds
2
Baths
1,585
Sq Ft
$94/Sq Ft
Est. Value
About This Home
This home is located at 723 3rd St SW, Cedar Rapids, IA 52404 and is currently estimated at $148,301, approximately $93 per square foot. 723 3rd St SW is a home located in Linn County with nearby schools including Cedar River Academy at Taylor Elementary School, Wilson Middle School, and Thomas Jefferson High School.
Ownership History
Date
Name
Owned For
Owner Type
Purchase Details
Closed on
Dec 7, 2007
Sold by
Hartman Danny R and Hartman Alison
Bought by
Magner Patrick
Current Estimated Value
Home Financials for this Owner
Home Financials are based on the most recent Mortgage that was taken out on this home.
Original Mortgage
$57,500
Interest Rate
6.31%
Mortgage Type
Seller Take Back
Purchase Details
Closed on
Aug 3, 2005
Sold by
Aragon Alvin L and Turner Leigh M
Bought by
Hartman Danny R and Hartman Alison
Home Financials for this Owner
Home Financials are based on the most recent Mortgage that was taken out on this home.
Original Mortgage
$10,000
Interest Rate
5.66%
Mortgage Type
Stand Alone Second
Purchase Details
Closed on
Dec 20, 2004
Sold by
Hughes Charles W and Hughes Shirley K
Bought by
Aragon Alvin L
Home Financials for this Owner
Home Financials are based on the most recent Mortgage that was taken out on this home.
Original Mortgage
$31,500
Interest Rate
8.37%
Mortgage Type
Unknown
Create a Home Valuation Report for This Property
The Home Valuation Report is an in-depth analysis detailing your home's value as well as a comparison with similar homes in the area
Home Values in the Area
Average Home Value in this Area
Purchase History
| Date | Buyer | Sale Price | Title Company |
|---|---|---|---|
| Magner Patrick | $57,500 | None Available | |
| Hartman Danny R | $49,500 | -- | |
| Aragon Alvin L | $34,500 | -- |
Source: Public Records
Mortgage History
| Date | Status | Borrower | Loan Amount |
|---|---|---|---|
| Closed | Magner Patrick | $57,500 | |
| Closed | Hartman Danny R | $10,000 | |
| Previous Owner | Aragon Alvin L | $31,500 |
Source: Public Records
Tax History
| Year | Tax Paid | Tax Assessment Tax Assessment Total Assessment is a certain percentage of the fair market value that is determined by local assessors to be the total taxable value of land and additions on the property. | Land | Improvement |
|---|---|---|---|---|
| 2025 | $1,580 | $112,500 | $22,400 | $90,100 |
| 2024 | $1,436 | $110,000 | $22,400 | $87,600 |
| 2023 | $1,436 | $99,700 | $16,000 | $83,700 |
| 2022 | $1,596 | $77,000 | $16,000 | $61,000 |
| 2021 | $1,326 | $77,000 | $16,000 | $61,000 |
| 2020 | $1,326 | $60,100 | $11,200 | $48,900 |
| 2019 | $1,343 | $58,500 | $9,600 | $48,900 |
Source: Public Records
Map
Nearby Homes
- 702 L St SW
- 525 2nd St SW
- 116 6th Ave SW
- 804 N St SW
- 513 2nd St SW
- 524 4th St SW
- 452 8th Ave SW
- 460 9th Ave SW
- 715 9th Ave SW
- 1435 N St SW
- 400 1st St SE Unit 204
- 400 1st St SE Unit 412
- 400 1st St SE Unit 303
- 400 1st St SE Unit 410
- 531 9th St SW
- 208 7th St SW
- 828 8th Ave SW
- 179 15th Ave SW
- Lot 42 Kestrel Heights
- 900 2nd St SE Unit 204
Your Personal Tour Guide
Ask me questions while you tour the home.