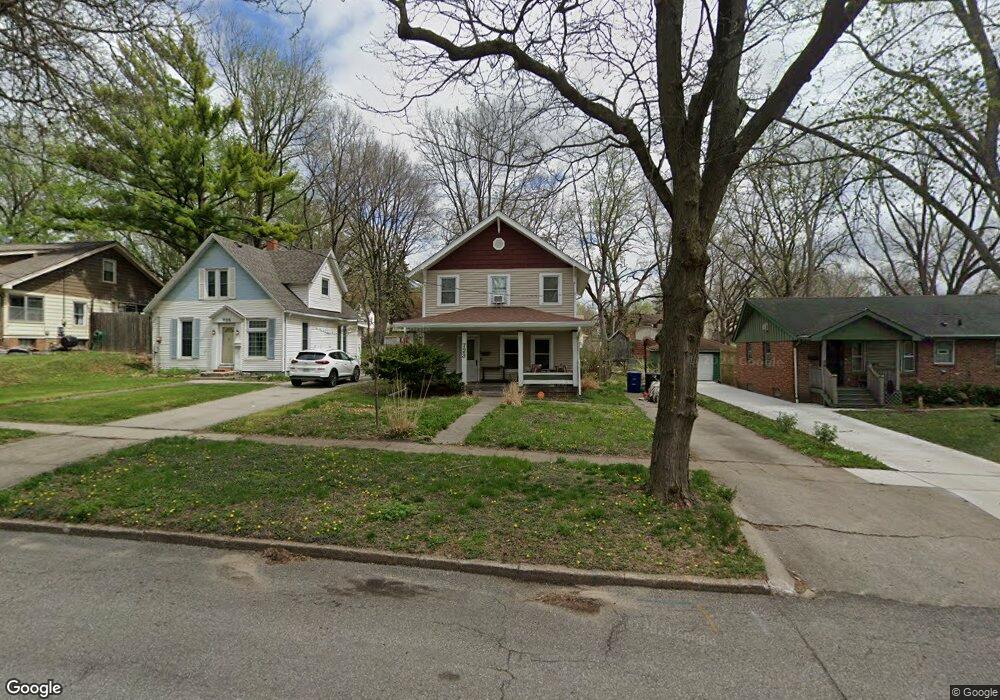
723 40th St Des Moines, IA 50312
North of Grand NeighborhoodEstimated Value: $244,000 - $324,000
4
Beds
1
Bath
1,808
Sq Ft
$152/Sq Ft
Est. Value
About This Home
This home is located at 723 40th St, Des Moines, IA 50312 and is currently estimated at $275,344, approximately $152 per square foot. 723 40th St is a home located in Polk County with nearby schools including Hubbell Elementary, Roosevelt High School, and St Augustin Catholic School.
Ownership History
Date
Name
Owned For
Owner Type
Purchase Details
Closed on
Apr 8, 1999
Sold by
Hanson Susan Marie and Ewers Marc
Bought by
Huey Duane A
Current Estimated Value
Home Financials for this Owner
Home Financials are based on the most recent Mortgage that was taken out on this home.
Original Mortgage
$71,963
Outstanding Balance
$17,699
Interest Rate
6.94%
Mortgage Type
FHA
Estimated Equity
$257,645
Create a Home Valuation Report for This Property
The Home Valuation Report is an in-depth analysis detailing your home's value as well as a comparison with similar homes in the area
Home Values in the Area
Average Home Value in this Area
Purchase History
| Date | Buyer | Sale Price | Title Company |
|---|---|---|---|
| Huey Duane A | $69,500 | -- |
Source: Public Records
Mortgage History
| Date | Status | Borrower | Loan Amount |
|---|---|---|---|
| Open | Huey Duane A | $71,963 |
Source: Public Records
Tax History Compared to Growth
Tax History
| Year | Tax Paid | Tax Assessment Tax Assessment Total Assessment is a certain percentage of the fair market value that is determined by local assessors to be the total taxable value of land and additions on the property. | Land | Improvement |
|---|---|---|---|---|
| 2025 | $4,150 | $255,500 | $49,800 | $205,700 |
| 2024 | $4,150 | $228,400 | $44,200 | $184,200 |
| 2023 | $4,742 | $228,400 | $44,200 | $184,200 |
| 2022 | $4,704 | $210,100 | $42,000 | $168,100 |
| 2021 | $4,526 | $210,100 | $42,000 | $168,100 |
| 2020 | $4,698 | $190,000 | $38,300 | $151,700 |
| 2019 | $4,232 | $190,000 | $38,300 | $151,700 |
| 2018 | $4,184 | $166,000 | $33,100 | $132,900 |
| 2017 | $3,610 | $166,000 | $33,100 | $132,900 |
| 2016 | $3,512 | $142,000 | $29,100 | $112,900 |
| 2015 | $3,512 | $142,000 | $29,100 | $112,900 |
| 2014 | $3,470 | $144,400 | $27,600 | $116,800 |
Source: Public Records
Map
Nearby Homes