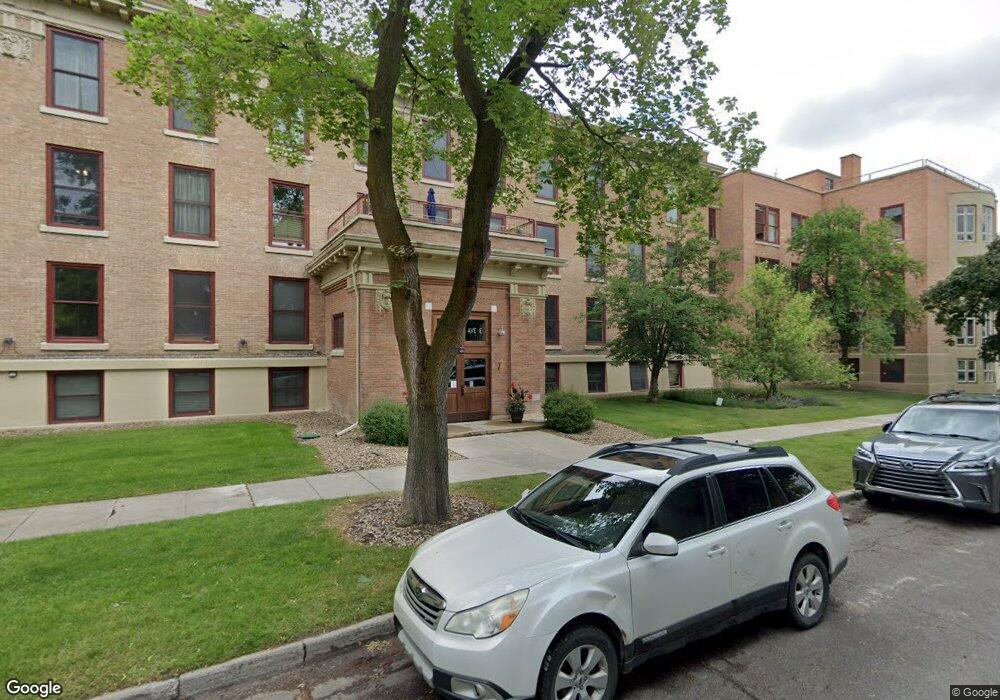
Eastside Brick 723 5th Ave E Kalispell, MT 59901
Estimated Value: $261,000 - $400,000
1
Bed
1
Bath
724
Sq Ft
$414/Sq Ft
Est. Value
About This Home
This home is located at 723 5th Ave E, Kalispell, MT 59901 and is currently estimated at $299,455, approximately $413 per square foot. 723 5th Ave E is a home located in Flathead County with nearby schools including Cornelius Hedges School, Kalispell Middle School, and Flathead High School.
Ownership History
Date
Name
Owned For
Owner Type
Purchase Details
Closed on
Oct 8, 2019
Sold by
Towner Zabyn R and Shriver Kathleen E
Bought by
Towner Zabyn T and Shriver Kathleen E
Current Estimated Value
Purchase Details
Closed on
Apr 30, 2018
Sold by
Towner Richmond F and Towner Debra A
Bought by
Towner Zabyn R and Shriver Kathleen E
Purchase Details
Closed on
Jun 21, 2013
Sold by
Rittmueller Adele J and Weis Frank
Bought by
Towner Richmond F and Towner Debra A
Home Financials for this Owner
Home Financials are based on the most recent Mortgage that was taken out on this home.
Original Mortgage
$41,000
Outstanding Balance
$29,152
Interest Rate
3.48%
Mortgage Type
Purchase Money Mortgage
Estimated Equity
$270,303
Purchase Details
Closed on
Apr 22, 2010
Sold by
Siderius Leann J
Bought by
Weis Frank and Rittmueller Adele J
Create a Home Valuation Report for This Property
The Home Valuation Report is an in-depth analysis detailing your home's value as well as a comparison with similar homes in the area
Purchase History
| Date | Buyer | Sale Price | Title Company |
|---|---|---|---|
| Towner Zabyn T | -- | None Available | |
| Towner Zabyn R | -- | Sterling Title | |
| Towner Richmond F | -- | None Available | |
| Weis Frank | -- | Sterling Title Services Inc |
Source: Public Records
Mortgage History
| Date | Status | Borrower | Loan Amount |
|---|---|---|---|
| Open | Towner Richmond F | $41,000 |
Source: Public Records
Tax History
| Year | Tax Paid | Tax Assessment Tax Assessment Total Assessment is a certain percentage of the fair market value that is determined by local assessors to be the total taxable value of land and additions on the property. | Land | Improvement |
|---|---|---|---|---|
| 2025 | $1,325 | $275,700 | $0 | $0 |
| 2024 | $1,534 | $197,000 | $0 | $0 |
| 2023 | $1,615 | $197,000 | $0 | $0 |
| 2022 | $1,559 | $142,800 | $0 | $0 |
| 2021 | $1,537 | $142,800 | $0 | $0 |
| 2020 | $1,450 | $124,800 | $0 | $0 |
| 2019 | $1,458 | $124,800 | $0 | $0 |
| 2018 | $1,501 | $123,000 | $0 | $0 |
| 2017 | $1,509 | $123,000 | $0 | $0 |
| 2016 | $1,395 | $123,000 | $0 | $0 |
| 2015 | $1,399 | $123,000 | $0 | $0 |
| 2014 | $1,395 | $73,436 | $0 | $0 |
Source: Public Records
About Eastside Brick
Map
Nearby Homes
- 715 8th St E
- 442 4th Ave E
- 519 1st Ave E
- 484 1st Ave E
- 826 11th St E
- 1305 4th Ave E
- 184 Lawrence Ln
- 51 Selders Ln
- 1312 2nd Ave E
- 31 5th Ave E
- 270 Caroline Rd
- 403 E Center St
- 442 2nd Ave W
- 100 Woodlands Way Unit S301
- 100 Woodlands Way Unit S305
- 100 Woodlands Way Unit S312
- 100 Woodlands Way Unit P-408
- 100 Woodlands Way Unit P-205
- 100 Woodlands Way Unit 410
- 100 Woodlands Way
Your Personal Tour Guide
Ask me questions while you tour the home.