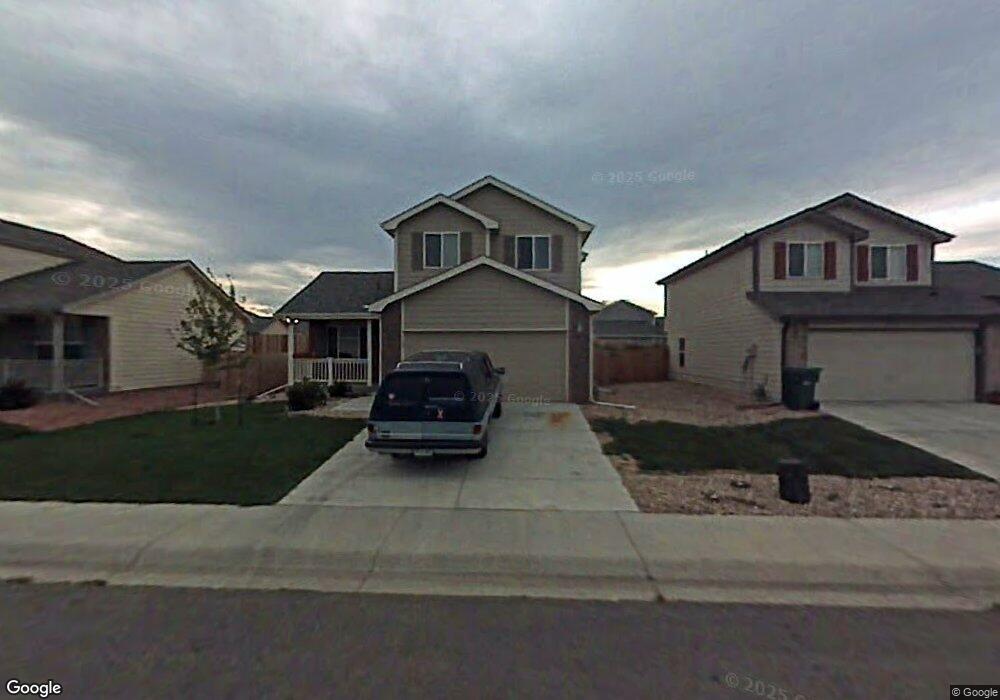
723 Carriage Dr Milliken, CO 80543
Estimated Value: $419,000 - $434,000
3
Beds
3
Baths
1,388
Sq Ft
$309/Sq Ft
Est. Value
About This Home
This home is located at 723 Carriage Dr, Milliken, CO 80543 and is currently estimated at $428,993, approximately $309 per square foot. 723 Carriage Dr is a home located in Weld County with nearby schools including Milliken Elementary School, Milliken Middle School, and Roosevelt High School.
Ownership History
Date
Name
Owned For
Owner Type
Purchase Details
Closed on
Oct 6, 2023
Sold by
Matter Jason Norbet
Bought by
Hartland Corey M and Soules Alexis J
Current Estimated Value
Home Financials for this Owner
Home Financials are based on the most recent Mortgage that was taken out on this home.
Original Mortgage
$15,513
Outstanding Balance
$3,330
Interest Rate
7.23%
Mortgage Type
New Conventional
Estimated Equity
$425,663
Purchase Details
Closed on
Jun 11, 2008
Sold by
Hsbc Bank Usa Na
Bought by
Matter Jason Norbet
Home Financials for this Owner
Home Financials are based on the most recent Mortgage that was taken out on this home.
Original Mortgage
$100,750
Interest Rate
5.99%
Mortgage Type
Unknown
Purchase Details
Closed on
Oct 25, 2005
Sold by
Bailey Homes Inc
Bought by
Schick Dennis K and Kershner Gretchen
Home Financials for this Owner
Home Financials are based on the most recent Mortgage that was taken out on this home.
Original Mortgage
$143,920
Interest Rate
8.75%
Mortgage Type
Fannie Mae Freddie Mac
Create a Home Valuation Report for This Property
The Home Valuation Report is an in-depth analysis detailing your home's value as well as a comparison with similar homes in the area
Home Values in the Area
Average Home Value in this Area
Purchase History
| Date | Buyer | Sale Price | Title Company |
|---|---|---|---|
| Hartland Corey M | $395,000 | None Listed On Document | |
| Matter Jason Norbet | -- | Chicago Title Co | |
| Schick Dennis K | $179,900 | Security Title |
Source: Public Records
Mortgage History
| Date | Status | Borrower | Loan Amount |
|---|---|---|---|
| Open | Hartland Corey M | $15,513 | |
| Open | Hartland Corey M | $387,845 | |
| Previous Owner | Matter Jason Norbet | $100,750 | |
| Previous Owner | Schick Dennis K | $143,920 |
Source: Public Records
Tax History Compared to Growth
Tax History
| Year | Tax Paid | Tax Assessment Tax Assessment Total Assessment is a certain percentage of the fair market value that is determined by local assessors to be the total taxable value of land and additions on the property. | Land | Improvement |
|---|---|---|---|---|
| 2025 | $2,365 | $24,640 | $5,880 | $18,760 |
| 2024 | $2,365 | $24,640 | $5,880 | $18,760 |
| 2023 | $2,406 | $27,170 | $5,410 | $21,760 |
| 2022 | $2,548 | $21,250 | $4,870 | $16,380 |
| 2021 | $2,769 | $21,860 | $5,010 | $16,850 |
| 2020 | $2,413 | $19,490 | $4,650 | $14,840 |
| 2019 | $1,915 | $19,490 | $4,650 | $14,840 |
| 2018 | $1,761 | $17,400 | $3,600 | $13,800 |
| 2017 | $1,743 | $17,400 | $3,600 | $13,800 |
| 2016 | $1,506 | $14,840 | $3,180 | $11,660 |
| 2015 | $1,518 | $14,840 | $3,180 | $11,660 |
| 2014 | $1,206 | $11,890 | $2,390 | $9,500 |
Source: Public Records
Map
Nearby Homes
- 714 School House Dr
- 843 Carriage Dr
- 842 S Carriage Dr
- 882 Carriage Dr
- 872 Settlers Dr
- 843 Settlers Dr
- 2661 Stage Coach Dr Unit C
- 1224 Sunrise Cir
- 805 Pioneer Dr
- 710 Village Dr
- 2580 Brookstone Dr Unit B
- 2581 Stage Coach Dr Unit D
- 2561 Stage Coach Dr Unit B
- 737 S Prairie Dr
- 2321 Stage Coach Dr Unit A
- 2321 Stage Coach Dr Unit B
- 698 Depot Dr
- 689 S Depot Dr
- 618 S Depot Dr
- 1973 Village Dr
- 723 S Carriage Dr
- 733 S Carriage Dr
- 733 Carriage Dr
- 713 Carriage Dr
- 743 S Carriage Dr
- 724 School House Dr
- 743 Carriage Dr
- 734 School House Dr
- 744 School House Dr
- 722 S Carriage Dr
- 722 Carriage Dr
- 753 S Carriage Dr
- 753 Carriage Dr
- 703 Carriage Dr
- 732 Carriage Dr
- 732 S Carriage Dr
- 712 Carriage Dr
- 712 S Carriage Dr
- 703 S Carriage Dr
- 742 S Carriage Dr