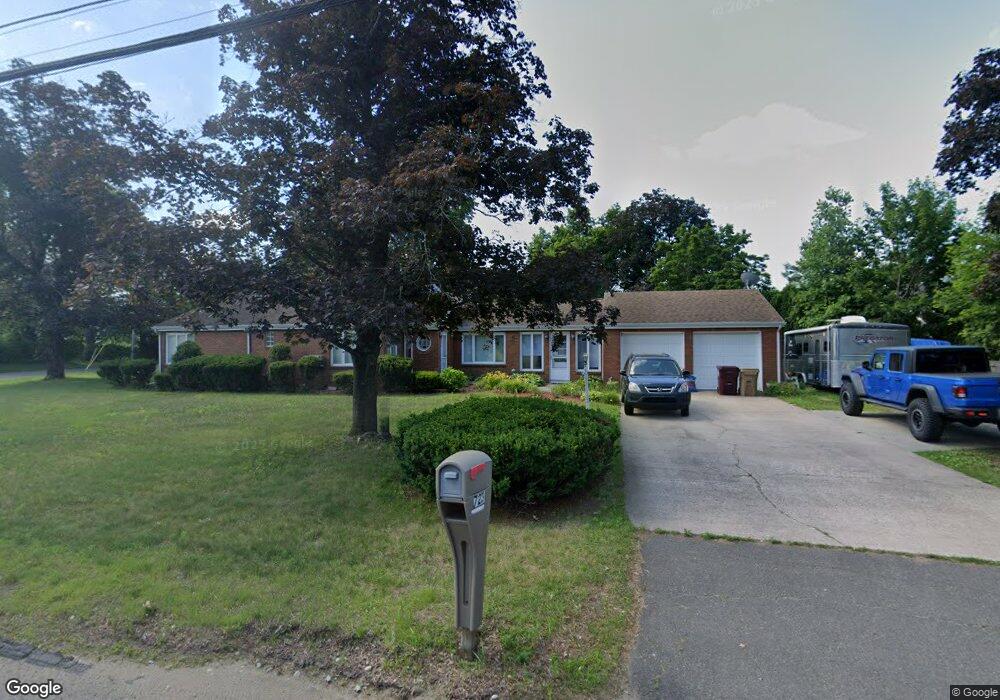
723 Chapin St Ludlow, MA 01056
Estimated Value: $348,530 - $536,000
2
Beds
2
Baths
1,649
Sq Ft
$248/Sq Ft
Est. Value
About This Home
This home is located at 723 Chapin St, Ludlow, MA 01056 and is currently estimated at $409,383, approximately $248 per square foot. 723 Chapin St is a home located in Hampden County with nearby schools including East Street Elementary School, Chapin Street Elementary School, and Paul R. Baird Middle School.
Ownership History
Date
Name
Owned For
Owner Type
Purchase Details
Closed on
Sep 26, 2008
Sold by
Deutsche Bank Natl T C
Bought by
Kwatowski Theresa B
Current Estimated Value
Home Financials for this Owner
Home Financials are based on the most recent Mortgage that was taken out on this home.
Original Mortgage
$170,000
Outstanding Balance
$112,882
Interest Rate
6.57%
Mortgage Type
Purchase Money Mortgage
Estimated Equity
$296,501
Purchase Details
Closed on
May 1, 2008
Sold by
Zrakas Denise J and Deutsche Bank Natl T C
Bought by
Deutsche Bank Natl T C
Purchase Details
Closed on
Aug 28, 2006
Sold by
James Jean
Bought by
Zrakas Denise J
Home Financials for this Owner
Home Financials are based on the most recent Mortgage that was taken out on this home.
Original Mortgage
$234,000
Interest Rate
6.83%
Mortgage Type
Purchase Money Mortgage
Create a Home Valuation Report for This Property
The Home Valuation Report is an in-depth analysis detailing your home's value as well as a comparison with similar homes in the area
Home Values in the Area
Average Home Value in this Area
Purchase History
| Date | Buyer | Sale Price | Title Company |
|---|---|---|---|
| Kwatowski Theresa B | $215,000 | -- | |
| Kwatowski Theresa B | $215,000 | -- | |
| Deutsche Bank Natl T C | $211,500 | -- | |
| Deutsche Bank Natl T C | $211,500 | -- | |
| Zrakas Denise J | $260,000 | -- | |
| Zrakas Denise J | $260,000 | -- |
Source: Public Records
Mortgage History
| Date | Status | Borrower | Loan Amount |
|---|---|---|---|
| Open | Kwatowski Theresa B | $170,000 | |
| Closed | Zrakas Denise J | $170,000 | |
| Previous Owner | Zrakas Denise J | $234,000 |
Source: Public Records
Tax History Compared to Growth
Tax History
| Year | Tax Paid | Tax Assessment Tax Assessment Total Assessment is a certain percentage of the fair market value that is determined by local assessors to be the total taxable value of land and additions on the property. | Land | Improvement |
|---|---|---|---|---|
| 2025 | $5,214 | $300,500 | $83,300 | $217,200 |
| 2024 | $4,962 | $274,300 | $84,400 | $189,900 |
| 2023 | $4,716 | $241,700 | $74,000 | $167,700 |
| 2022 | $4,470 | $223,600 | $74,000 | $149,600 |
| 2021 | $4,471 | $212,100 | $74,000 | $138,100 |
| 2020 | $4,283 | $207,700 | $72,900 | $134,800 |
| 2019 | $7,020 | $202,400 | $72,200 | $130,200 |
| 2018 | $3,753 | $197,400 | $72,200 | $125,200 |
| 2017 | $3,645 | $196,700 | $70,800 | $125,900 |
| 2016 | $3,423 | $188,800 | $69,400 | $119,400 |
| 2015 | $3,247 | $187,800 | $68,600 | $119,200 |
Source: Public Records
Map
Nearby Homes
- 42 Loopley St
- 98 Fuller St Unit 32
- 84 Chapin Greene Dr
- 70 Fuller St
- 0 Fuller St Unit 73409741
- 32 White St
- 61 Massachusetts Ave
- 382 Holyoke St
- 70 Sroka Ln
- 50 Warsaw Ave
- 87 Haviland St
- 81-83 Motyka St
- '0' Rood St
- 665 Center St Unit 705
- 665 Center St Unit 311
- 665 Center St Unit 706
- 184 Howard St
- 436 Holyoke St
- 24 Elm St
- 353 Fuller St Unit 8