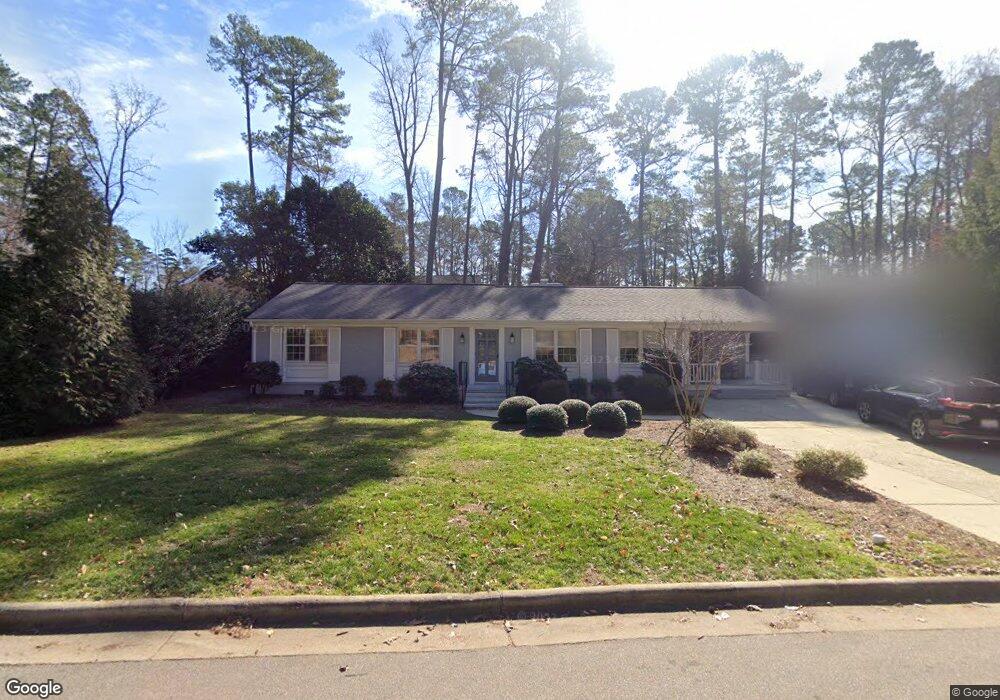
723 Davidson St Raleigh, NC 27609
North Hills NeighborhoodEstimated Value: $913,000 - $1,012,000
3
Beds
3
Baths
2,012
Sq Ft
$471/Sq Ft
Est. Value
About This Home
This home is located at 723 Davidson St, Raleigh, NC 27609 and is currently estimated at $947,234, approximately $470 per square foot. 723 Davidson St is a home located in Wake County with nearby schools including Brooks Elementary, Carroll Middle, and Sanderson High School.
Ownership History
Date
Name
Owned For
Owner Type
Purchase Details
Closed on
Apr 5, 2021
Sold by
Honeycutt Andrew Hinton and Honeycutt Parker Chesnutt
Bought by
Pietruszynski David and Pietruszynski Mary Ellen
Current Estimated Value
Purchase Details
Closed on
Mar 23, 2012
Sold by
Honeycutt Andrew Hinton and Honeycutt Parker Chestnutt
Bought by
Honeycutt Andrew Hinton and Honeycutt Parker Chestnutt
Purchase Details
Closed on
Mar 28, 2005
Sold by
Core Henry K and Forlines Core Alesia R
Bought by
Honeycutt Andrew Hinton
Home Financials for this Owner
Home Financials are based on the most recent Mortgage that was taken out on this home.
Original Mortgage
$186,800
Interest Rate
5.12%
Mortgage Type
Fannie Mae Freddie Mac
Purchase Details
Closed on
Apr 27, 2000
Sold by
Wood Scott M
Bought by
Core Henry K
Create a Home Valuation Report for This Property
The Home Valuation Report is an in-depth analysis detailing your home's value as well as a comparison with similar homes in the area
Home Values in the Area
Average Home Value in this Area
Purchase History
| Date | Buyer | Sale Price | Title Company |
|---|---|---|---|
| Pietruszynski David | $735,000 | None Available | |
| Honeycutt Andrew Hinton | -- | None Available | |
| Honeycutt Andrew Hinton | $234,000 | -- | |
| Core Henry K | $175,500 | -- |
Source: Public Records
Mortgage History
| Date | Status | Borrower | Loan Amount |
|---|---|---|---|
| Previous Owner | Honeycutt Andrew Hinton | $186,800 |
Source: Public Records
Tax History
| Year | Tax Paid | Tax Assessment Tax Assessment Total Assessment is a certain percentage of the fair market value that is determined by local assessors to be the total taxable value of land and additions on the property. | Land | Improvement |
|---|---|---|---|---|
| 2025 | $7,246 | $828,596 | $575,000 | $253,596 |
| 2024 | $7,216 | $828,596 | $575,000 | $253,596 |
Source: Public Records
Map
Nearby Homes
- 802 Tyrrell Rd
- 806 Tyrrell Rd
- 4801 Rampart St
- 613 Sampson St
- 1116 Kimberly Dr
- 4421 Pamlico Dr
- 900 Currituck Dr
- 4907 Yadkin Dr
- 708 Catawba St
- 725 Catawba St
- 1216 Gunnison Place
- 4830 N Hills Dr
- 812 Manchester Dr
- 4123 Rockingham Dr
- 5024 Yadkin Dr
- 721 Currituck Dr
- 4119 Rockingham Dr
- 1105 Manchester Dr
- 4112 Rockingham Dr
- 5301 Thayer Dr
- 719 Davidson St
- 727 Davidson St
- 712 Richmond St
- 716 Richmond St
- 713 Davidson St
- 731 Davidson St
- 708 Richmond St
- 728 Davidson St
- 724 Davidson St
- 720 Richmond St
- 709 Davidson St
- 720 Davidson St
- 801 Davidson St
- 716 Davidson St
- 724 Richmond St
- 704 Richmond St
- 1101 Hyde St
- 1104 Hyde St
- 712 Davidson St
- 713 Richmond St
Your Personal Tour Guide
Ask me questions while you tour the home.