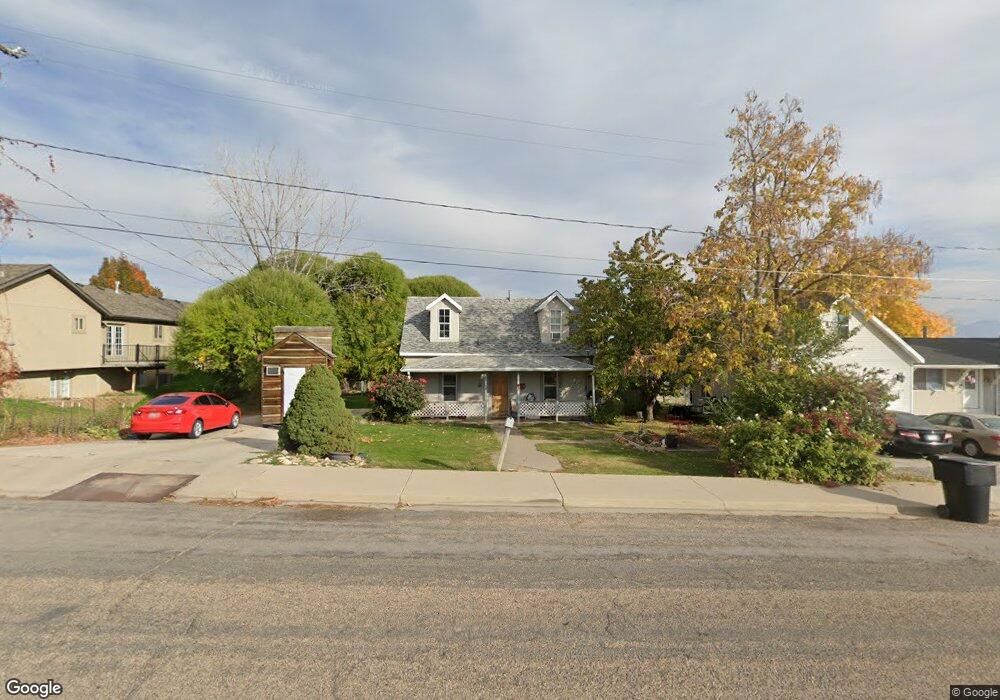
723 E 100 S Payson, UT 84651
Estimated Value: $457,000 - $563,000
6
Beds
3
Baths
3,336
Sq Ft
$151/Sq Ft
Est. Value
About This Home
This home is located at 723 E 100 S, Payson, UT 84651 and is currently estimated at $504,510, approximately $151 per square foot. 723 E 100 S is a home located in Utah County with nearby schools including Barnett Elementary School, Salem Junior High School, and Valley View Middle School.
Ownership History
Date
Name
Owned For
Owner Type
Purchase Details
Closed on
Jan 25, 2022
Sold by
Brian Maylan D and Brian Corina L
Bought by
Brian Family Trust and Brian
Current Estimated Value
Purchase Details
Closed on
Apr 17, 1998
Sold by
Christensen Corey and Christensen Maryanne K
Bought by
Christensen Corey J and Christensen Maryanne K
Home Financials for this Owner
Home Financials are based on the most recent Mortgage that was taken out on this home.
Original Mortgage
$120,000
Interest Rate
7.15%
Create a Home Valuation Report for This Property
The Home Valuation Report is an in-depth analysis detailing your home's value as well as a comparison with similar homes in the area
Home Values in the Area
Average Home Value in this Area
Purchase History
| Date | Buyer | Sale Price | Title Company |
|---|---|---|---|
| Brian Family Trust | -- | Wasatch Land & Title | |
| Christensen Corey J | -- | -- |
Source: Public Records
Mortgage History
| Date | Status | Borrower | Loan Amount |
|---|---|---|---|
| Previous Owner | Christensen Corey J | $120,000 |
Source: Public Records
Tax History
| Year | Tax Paid | Tax Assessment Tax Assessment Total Assessment is a certain percentage of the fair market value that is determined by local assessors to be the total taxable value of land and additions on the property. | Land | Improvement |
|---|---|---|---|---|
| 2025 | $2,372 | $226,380 | -- | -- |
| 2024 | $2,372 | $241,395 | $0 | $0 |
| 2023 | $2,492 | $254,265 | $0 | $0 |
| 2022 | $2,395 | $240,405 | $0 | $0 |
| 2021 | $1,977 | $318,200 | $86,700 | $231,500 |
| 2020 | $1,890 | $297,600 | $78,800 | $218,800 |
| 2019 | $1,684 | $271,900 | $68,100 | $203,800 |
| 2018 | $1,507 | $234,500 | $57,300 | $177,200 |
| 2017 | $1,515 | $126,775 | $0 | $0 |
| 2016 | $1,340 | $111,430 | $0 | $0 |
| 2015 | $1,178 | $97,295 | $0 | $0 |
| 2014 | $1,059 | $88,055 | $0 | $0 |
Source: Public Records
Map
Nearby Homes
- 862 E 200 S
- 1058 E 100 N
- 977 E 100 S
- 981 E 100 S
- 873 E 200 N
- 252 S 400 E
- 332 N 500 E
- 1287 N 1390 E Unit 25-96
- 551 E 500 S
- 228 E Utah Ave
- 1298 1670 N
- 1299 E 1670 N Unit 812
- 1299 E 1670 N
- 116 E 100 S
- 412 S Goosenest Dr
- 426 S Goosenest Dr
- 118 E 100 N
- 339 N 500 E Unit 3
- 327 N 500 E Unit 2
- 331 N 500 E Unit 2
Your Personal Tour Guide
Ask me questions while you tour the home.