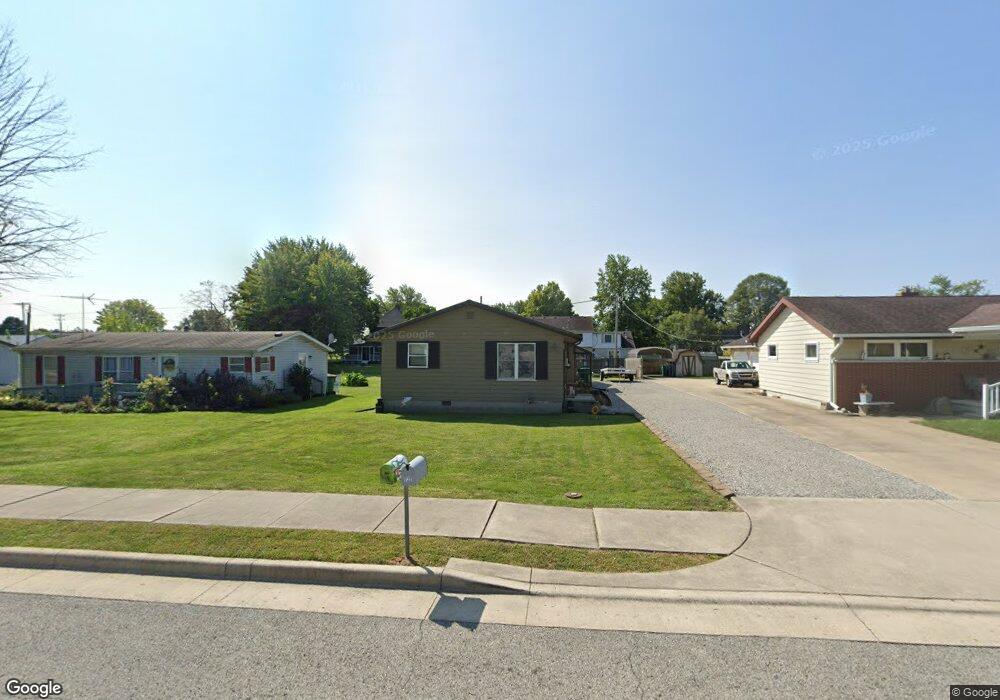
723 E Grant St Greentown, IN 46936
Estimated Value: $111,461 - $120,000
2
Beds
1
Bath
768
Sq Ft
$150/Sq Ft
Est. Value
About This Home
This home is located at 723 E Grant St, Greentown, IN 46936 and is currently estimated at $115,365, approximately $150 per square foot. 723 E Grant St is a home located in Howard County with nearby schools including Eastern Elementary School and Eastern High School.
Ownership History
Date
Name
Owned For
Owner Type
Purchase Details
Closed on
May 19, 2025
Sold by
Thomas Penny L
Bought by
Thomas Trey N
Current Estimated Value
Home Financials for this Owner
Home Financials are based on the most recent Mortgage that was taken out on this home.
Original Mortgage
$85,400
Outstanding Balance
$84,863
Interest Rate
6.62%
Mortgage Type
New Conventional
Estimated Equity
$30,502
Purchase Details
Closed on
Feb 18, 2020
Sold by
Wyrick Robert J and Wyrick Virginia D
Bought by
Thomas Penny L
Home Financials for this Owner
Home Financials are based on the most recent Mortgage that was taken out on this home.
Original Mortgage
$56,000
Interest Rate
3.6%
Mortgage Type
New Conventional
Create a Home Valuation Report for This Property
The Home Valuation Report is an in-depth analysis detailing your home's value as well as a comparison with similar homes in the area
Purchase History
| Date | Buyer | Sale Price | Title Company |
|---|---|---|---|
| Thomas Trey N | -- | Meridian Title | |
| Thomas Penny L | $74,480 | Peelle Law Office |
Source: Public Records
Mortgage History
| Date | Status | Borrower | Loan Amount |
|---|---|---|---|
| Open | Thomas Trey N | $85,400 | |
| Previous Owner | Thomas Penny L | $56,000 |
Source: Public Records
Tax History
| Year | Tax Paid | Tax Assessment Tax Assessment Total Assessment is a certain percentage of the fair market value that is determined by local assessors to be the total taxable value of land and additions on the property. | Land | Improvement |
|---|---|---|---|---|
| 2025 | $491 | $88,700 | $13,900 | $74,800 |
| 2024 | $505 | $83,300 | $13,900 | $69,400 |
| 2022 | $436 | $74,800 | $13,900 | $60,900 |
| 2021 | $368 | $64,700 | $11,400 | $53,300 |
| 2020 | $367 | $67,600 | $11,400 | $56,200 |
| 2019 | $1,276 | $63,500 | $11,400 | $52,100 |
| 2018 | $1,142 | $56,800 | $11,400 | $45,400 |
| 2017 | $1,146 | $57,000 | $11,900 | $45,100 |
| 2016 | $1,066 | $53,000 | $11,900 | $41,100 |
| 2014 | $960 | $47,700 | $11,900 | $35,800 |
| 2013 | $1,011 | $50,300 | $11,900 | $38,400 |
Source: Public Records
Map
Nearby Homes
- 718 E Walnut St
- 9095 E 00 Ns
- 533 E Main St
- 524 E Grant St
- 529 Uncle Tom St
- 329 E Lincoln St
- 228 E Railroad St
- 218 N Howard St
- 1009 Eastcrest Dr
- 506 S Harrison St
- 6936 Cassell Dr
- 36 Timberly Dr
- 11766 E 100 N
- 8937 E 300 S
- 3948 S 1100 E
- 10955 E 400 S
- 1263 N 1350 E
- 6633 E 400 S
- 12631 E 300 S
- 12160 E 400 N
Your Personal Tour Guide
Ask me questions while you tour the home.