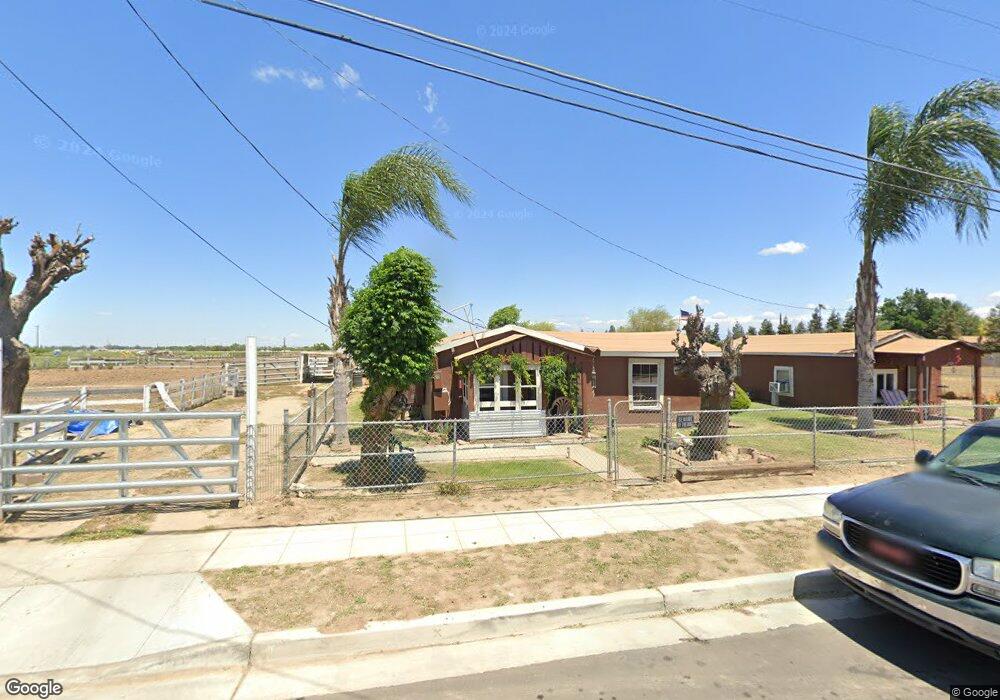
723 E Samson Ave Fresno, CA 93706
Edison NeighborhoodEstimated Value: $221,476 - $376,000
1
Bed
1
Bath
728
Sq Ft
$426/Sq Ft
Est. Value
About This Home
This home is located at 723 E Samson Ave, Fresno, CA 93706 and is currently estimated at $309,825, approximately $425 per square foot. 723 E Samson Ave is a home located in Fresno County with nearby schools including West Fresno Middle School, Washington High School, and W.E.B DuBois Academy.
Ownership History
Date
Name
Owned For
Owner Type
Purchase Details
Closed on
Sep 16, 2025
Sold by
Hemmitt Family Grantor Trust and Quincy Dwight
Bought by
Quincy Dwight
Current Estimated Value
Purchase Details
Closed on
Dec 27, 2018
Sold by
Hemmitt Wanda A and Hemmitt Patton Wanda A
Bought by
Quincy Dwight
Purchase Details
Closed on
Mar 11, 2011
Sold by
Hemmitt Euteen M
Bought by
Hemmitt Patton Wanda A
Purchase Details
Closed on
Mar 10, 2011
Sold by
Hemmitt Euteen M
Bought by
Hemmitt Patton Wanda A
Purchase Details
Closed on
Mar 9, 2011
Sold by
Hemmitt Euteen M
Bought by
Hemmitt Patton Wanda A
Purchase Details
Closed on
Mar 8, 2011
Sold by
Hemmitt Euteen M
Bought by
Hemmitt Patton Wanda A
Purchase Details
Closed on
Mar 7, 2011
Sold by
Hemmitt Euteen M
Bought by
Hemmitt Patton Wanda A
Purchase Details
Closed on
Jun 24, 2004
Sold by
Hemmitt Euteen
Bought by
Hemmitt Euteen M
Create a Home Valuation Report for This Property
The Home Valuation Report is an in-depth analysis detailing your home's value as well as a comparison with similar homes in the area
Home Values in the Area
Average Home Value in this Area
Purchase History
| Date | Buyer | Sale Price | Title Company |
|---|---|---|---|
| Quincy Dwight | -- | None Listed On Document | |
| Quincy Dwight | -- | None Available | |
| Hemmitt Patton Wanda A | -- | None Available | |
| Hemmitt Patton Wanda A | -- | None Available | |
| Hemmitt Patton Wanda A | -- | None Available | |
| Hemmitt Patton Wanda A | -- | None Available | |
| Hemmitt Patton Wanda A | -- | None Available | |
| Hemmitt Euteen M | -- | None Available | |
| Hemmitt Euteen M | -- | -- |
Source: Public Records
Tax History
| Year | Tax Paid | Tax Assessment Tax Assessment Total Assessment is a certain percentage of the fair market value that is determined by local assessors to be the total taxable value of land and additions on the property. | Land | Improvement |
|---|---|---|---|---|
| 2025 | $767 | $36,899 | $25,381 | $11,518 |
| 2023 | $709 | $35,469 | $24,397 | $11,072 |
| 2022 | $603 | $34,774 | $23,919 | $10,855 |
| 2021 | $603 | $34,093 | $23,450 | $10,643 |
| 2020 | $574 | $33,744 | $23,210 | $10,534 |
| 2019 | $567 | $33,083 | $22,755 | $10,328 |
| 2018 | $553 | $32,435 | $22,309 | $10,126 |
| 2017 | $544 | $31,800 | $21,872 | $9,928 |
| 2016 | $524 | $31,178 | $21,444 | $9,734 |
| 2015 | $519 | $30,710 | $21,122 | $9,588 |
| 2014 | $510 | $30,110 | $20,709 | $9,401 |
Source: Public Records
Map
Nearby Homes
- 2990 S Martin Luther King Junior Blvd
- 385 W Almy Ave
- 721 E Annadale Ave
- 2695 S Tupman Ave
- 1871 E Vine Ave
- 3232 S Elm Ave
- 937 E Calwa Ave
- 506 E Jensen Ave
- 1775 E Vine Ave
- 0 Apn 328-050-37
- 0 E Annadale Ave Unit 641839
- 0 E Annadale Ave Unit 641761
- 0 E Annadale Ave Unit 641984
- 1123 E Garrett Ave
- 358 E Kaviland Ave
- 1883 E Vine Ave
- 316 E Kaviland Ave
- 6394 S Cherry Ave
- 2555 S Lotus Ave
- 2523 S Lily Ave
- 748 E Samson Ave
- 739 E Samson Ave Unit R
- 739 E Samson Ave
- 760 E Samson Ave
- 806 E Samson Ave
- 816 E Samson Ave
- 839 E Samson Ave
- 753 E Hardy Ave
- 828 E Samson Ave
- 759 E Hardy Ave
- 771 E Hardy Ave
- 834 E Samson Ave
- 817 E Hardy Ave
- 827 E Hardy Ave
- 840 E Samson Ave
- 747 E Hardy Ave
- 833 E Hardy Ave
- 2954 Martin L King Jr Blvd
- 837 E Hardy Ave
- 2908 S Martin L King Jr Blvd
Your Personal Tour Guide
Ask me questions while you tour the home.