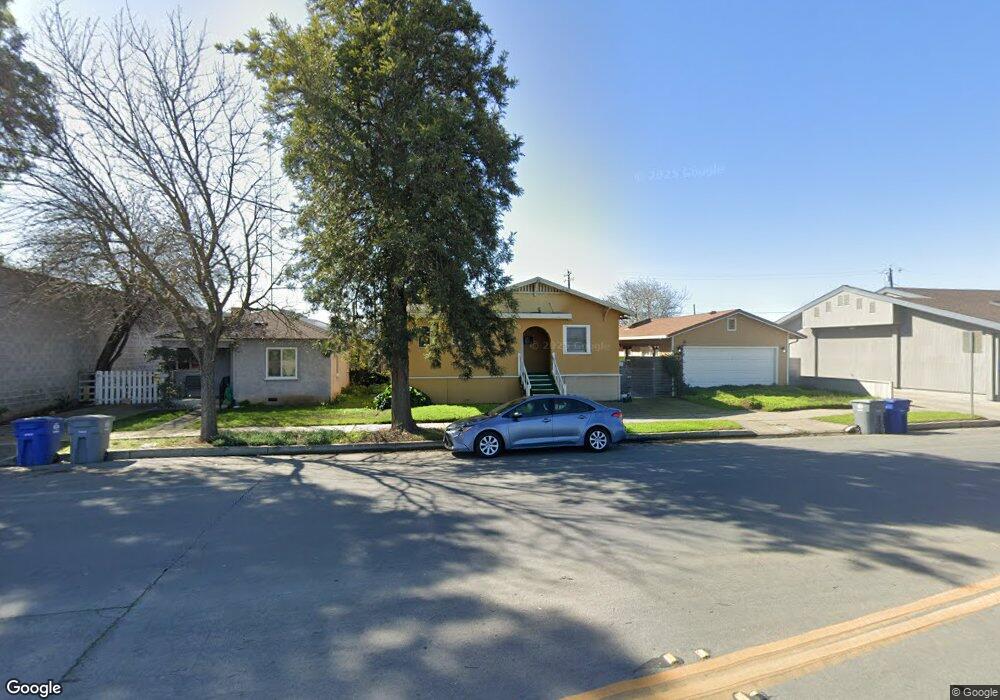
723 H St Unit 12 Los Banos, CA 93635
Estimated Value: $212,000 - $290,000
1
Bed
1
Bath
878
Sq Ft
$287/Sq Ft
Est. Value
About This Home
This home is located at 723 H St Unit 12, Los Banos, CA 93635 and is currently estimated at $252,041, approximately $287 per square foot. 723 H St Unit 12 is a home located in Merced County with nearby schools including Los Banos Elementary School, Creekside Junior High School, and Los Banos High School.
Ownership History
Date
Name
Owned For
Owner Type
Purchase Details
Closed on
Apr 8, 2015
Sold by
Caropreso Gary
Bought by
Caropreso Cathy
Current Estimated Value
Purchase Details
Closed on
Apr 7, 2015
Sold by
Caropreso Cathy and Cotta Alan
Bought by
Burch Daniel L
Purchase Details
Closed on
Jan 27, 2000
Sold by
Caropreso Cathy
Bought by
Caropreso Cathy and Cotta Alan
Purchase Details
Closed on
Apr 25, 1997
Sold by
Joe Bartolo and Joe Joseph
Bought by
Bartolo Joseph Nello
Create a Home Valuation Report for This Property
The Home Valuation Report is an in-depth analysis detailing your home's value as well as a comparison with similar homes in the area
Home Values in the Area
Average Home Value in this Area
Purchase History
| Date | Buyer | Sale Price | Title Company |
|---|---|---|---|
| Caropreso Cathy | -- | Transcounty Title Company | |
| Cotta Alan | -- | Transcounty Title Company | |
| Burch Daniel L | $60,000 | Transcounty Title Company | |
| Caropreso Cathy | -- | -- | |
| Bartolo Joseph Nello | -- | -- |
Source: Public Records
Tax History Compared to Growth
Tax History
| Year | Tax Paid | Tax Assessment Tax Assessment Total Assessment is a certain percentage of the fair market value that is determined by local assessors to be the total taxable value of land and additions on the property. | Land | Improvement |
|---|---|---|---|---|
| 2025 | $729 | $72,102 | $36,051 | $36,051 |
| 2024 | $729 | $70,690 | $35,345 | $35,345 |
| 2023 | $688 | $69,304 | $34,652 | $34,652 |
| 2022 | $675 | $67,946 | $33,973 | $33,973 |
| 2021 | $667 | $66,614 | $33,307 | $33,307 |
| 2020 | $658 | $65,932 | $32,966 | $32,966 |
| 2019 | $645 | $64,640 | $32,320 | $32,320 |
| 2018 | $623 | $63,374 | $31,687 | $31,687 |
| 2017 | $615 | $62,132 | $31,066 | $31,066 |
| 2016 | $620 | $60,914 | $30,457 | $30,457 |
| 2015 | $597 | $52,166 | $26,083 | $26,083 |
| 2014 | $581 | $51,146 | $25,573 | $25,573 |
Source: Public Records
Map
Nearby Homes