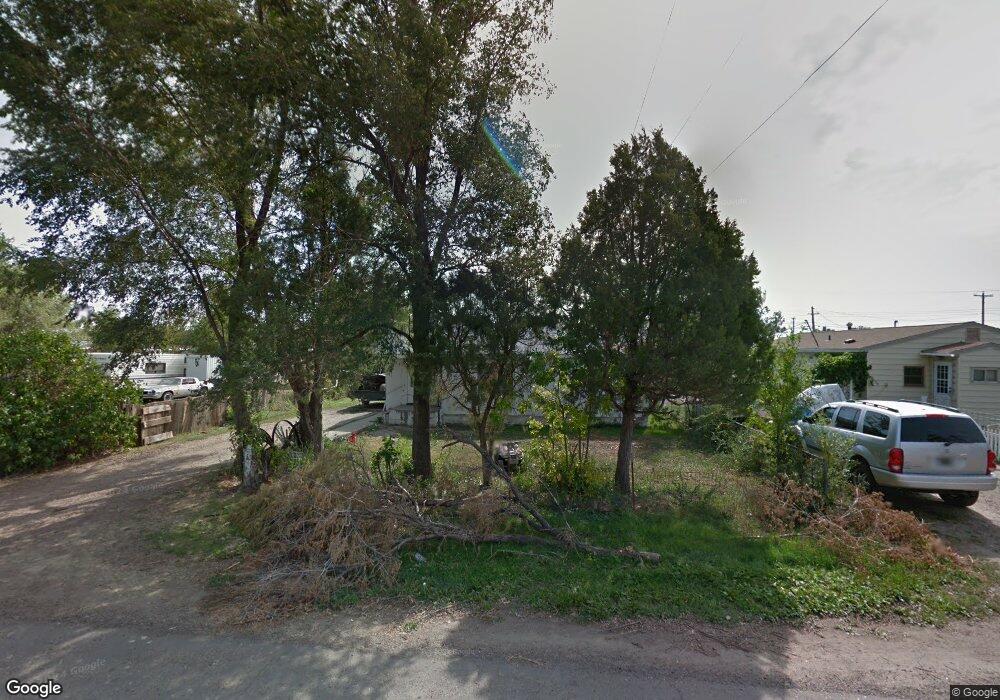
723 O Neil St Glendive, MT 59330
Estimated Value: $115,110 - $166,000
3
Beds
1
Bath
1,040
Sq Ft
$135/Sq Ft
Est. Value
About This Home
This home is located at 723 O Neil St, Glendive, MT 59330 and is currently estimated at $140,555, approximately $135 per square foot. 723 O Neil St is a home located in Dawson County with nearby schools including Jefferson Elementary School, Lincoln School, and Washington Middle School.
Ownership History
Date
Name
Owned For
Owner Type
Purchase Details
Closed on
May 25, 2017
Sold by
Angelo Crisafulli Trust
Bought by
Deckert David S
Current Estimated Value
Home Financials for this Owner
Home Financials are based on the most recent Mortgage that was taken out on this home.
Original Mortgage
$23,000
Outstanding Balance
$19,059
Interest Rate
3.97%
Mortgage Type
New Conventional
Estimated Equity
$121,496
Purchase Details
Closed on
May 13, 1996
Bought by
Crisafulli Angelo & Vera (Trustees)
Create a Home Valuation Report for This Property
The Home Valuation Report is an in-depth analysis detailing your home's value as well as a comparison with similar homes in the area
Home Values in the Area
Average Home Value in this Area
Purchase History
| Date | Buyer | Sale Price | Title Company |
|---|---|---|---|
| Deckert David S | -- | First American Title | |
| Crisafulli Angelo & Vera (Trustees) | -- | -- |
Source: Public Records
Mortgage History
| Date | Status | Borrower | Loan Amount |
|---|---|---|---|
| Open | Deckert David S | $23,000 |
Source: Public Records
Tax History Compared to Growth
Tax History
| Year | Tax Paid | Tax Assessment Tax Assessment Total Assessment is a certain percentage of the fair market value that is determined by local assessors to be the total taxable value of land and additions on the property. | Land | Improvement |
|---|---|---|---|---|
| 2025 | $1,233 | $65,300 | $0 | $0 |
| 2024 | $1,595 | $71,600 | $0 | $0 |
| 2023 | $1,562 | $71,600 | $0 | $0 |
| 2022 | $1,370 | $53,200 | $0 | $0 |
| 2021 | $480 | $53,200 | $0 | $0 |
| 2020 | $769 | $55,544 | $0 | $0 |
| 2019 | $783 | $55,544 | $0 | $0 |
| 2018 | $1,366 | $70,179 | $0 | $0 |
| 2017 | $1,377 | $70,359 | $0 | $0 |
| 2016 | $1,490 | $67,085 | $0 | $0 |
| 2015 | $652 | $67,085 | $0 | $0 |
| 2014 | $292 | $16,907 | $0 | $0 |
Source: Public Records
Map
Nearby Homes