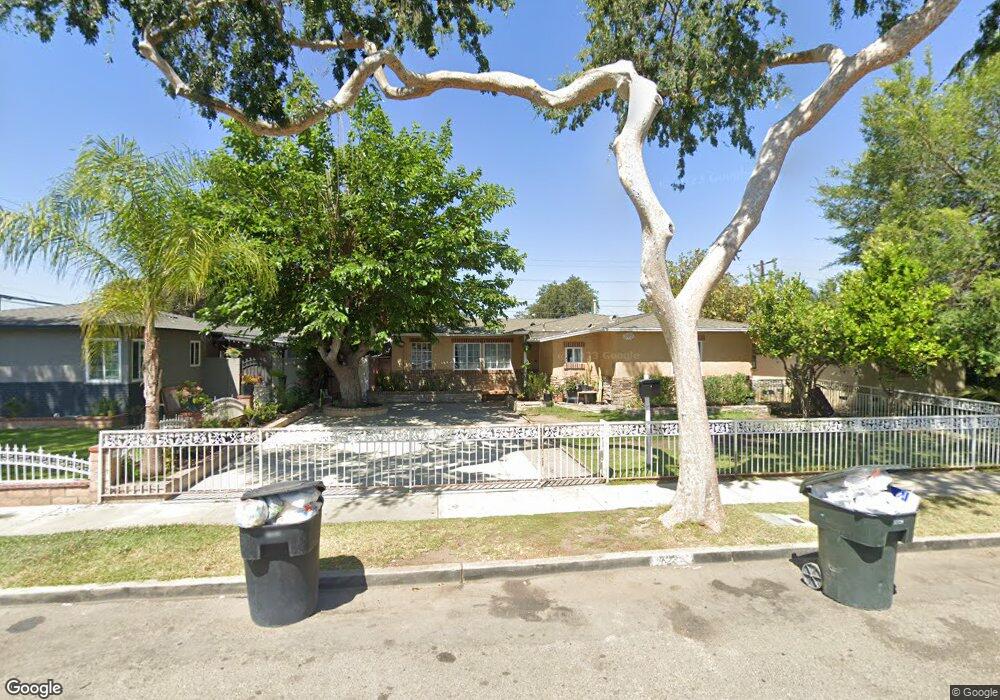
723 S Ohio St Anaheim, CA 92805
The Colony NeighborhoodEstimated Value: $898,000 - $1,044,000
3
Beds
2
Baths
1,490
Sq Ft
$646/Sq Ft
Est. Value
About This Home
This home is located at 723 S Ohio St, Anaheim, CA 92805 and is currently estimated at $962,598, approximately $646 per square foot. 723 S Ohio St is a home located in Orange County with nearby schools including Benjamin Franklin Elementary School, Sycamore Junior High School, and Anaheim High School.
Ownership History
Date
Name
Owned For
Owner Type
Purchase Details
Closed on
Jun 6, 1996
Sold by
Rodriguez Guillermina
Bought by
Rodriguez Tomas
Current Estimated Value
Home Financials for this Owner
Home Financials are based on the most recent Mortgage that was taken out on this home.
Original Mortgage
$143,500
Interest Rate
8.01%
Mortgage Type
Balloon
Purchase Details
Closed on
Apr 10, 1996
Sold by
Rodriguez Jose and Rodriguez Guadalupe
Bought by
Rodriguez Tomas and Rodriguez Guillermina
Home Financials for this Owner
Home Financials are based on the most recent Mortgage that was taken out on this home.
Original Mortgage
$143,500
Interest Rate
8.01%
Mortgage Type
Balloon
Purchase Details
Closed on
Mar 28, 1996
Sold by
Magana Hector Guerrero
Bought by
Rodriguez Tomas and Rodriguez Guillermina
Purchase Details
Closed on
Oct 12, 1993
Sold by
Garcia Fernando Jaquez and Jaquez Maria Elena
Bought by
Rodriguez Tomas and Rodriguez Guillermina
Create a Home Valuation Report for This Property
The Home Valuation Report is an in-depth analysis detailing your home's value as well as a comparison with similar homes in the area
Home Values in the Area
Average Home Value in this Area
Purchase History
| Date | Buyer | Sale Price | Title Company |
|---|---|---|---|
| Rodriguez Tomas | -- | Fidelity National Title Co | |
| Rodriguez Tomas | -- | Fidelity National Title Ins | |
| Rodriguez Tomas | -- | Fidelity National Title Co | |
| Magana Hector Guerrero | -- | Fidelity National Title Co | |
| Rodriguez Tomas | -- | Fidelity National Title Ins |
Source: Public Records
Mortgage History
| Date | Status | Borrower | Loan Amount |
|---|---|---|---|
| Closed | Rodriguez Tomas | $143,500 |
Source: Public Records
Tax History Compared to Growth
Tax History
| Year | Tax Paid | Tax Assessment Tax Assessment Total Assessment is a certain percentage of the fair market value that is determined by local assessors to be the total taxable value of land and additions on the property. | Land | Improvement |
|---|---|---|---|---|
| 2025 | $3,202 | $268,030 | $183,549 | $84,481 |
| 2024 | $3,202 | $262,775 | $179,950 | $82,825 |
| 2023 | $3,131 | $257,623 | $176,422 | $81,201 |
| 2022 | $3,087 | $252,572 | $172,963 | $79,609 |
| 2021 | $3,089 | $247,620 | $169,571 | $78,049 |
| 2020 | $3,074 | $245,081 | $167,832 | $77,249 |
| 2019 | $2,985 | $240,276 | $164,541 | $75,735 |
| 2018 | $2,924 | $235,565 | $161,315 | $74,250 |
| 2017 | $2,811 | $230,947 | $158,152 | $72,795 |
| 2016 | $2,801 | $226,419 | $155,051 | $71,368 |
| 2015 | $2,774 | $223,018 | $152,722 | $70,296 |
| 2014 | $2,607 | $218,650 | $149,731 | $68,919 |
Source: Public Records
Map
Nearby Homes
- 701 W Provential Dr
- 719 S Pine St
- 523 S Citron St
- 526 W Water St
- 615 S Hazelwood St
- 1131 W Beacon Ave
- 616 S Boxwood St
- 609 S Helena St
- 967 S Citron St Unit 3
- 951 S Citron St Unit 5
- 1028 S Citron St Unit 16
- 936 S David St
- 1124 S Citron St Unit 85
- 628 S Clementine St
- 1136 W Broadway
- 833 S Lemon St
- 1810 W Bushell St
- 208 S Illinois St
- 1316 W Beacon Ave
- 713 S Anaheim Blvd