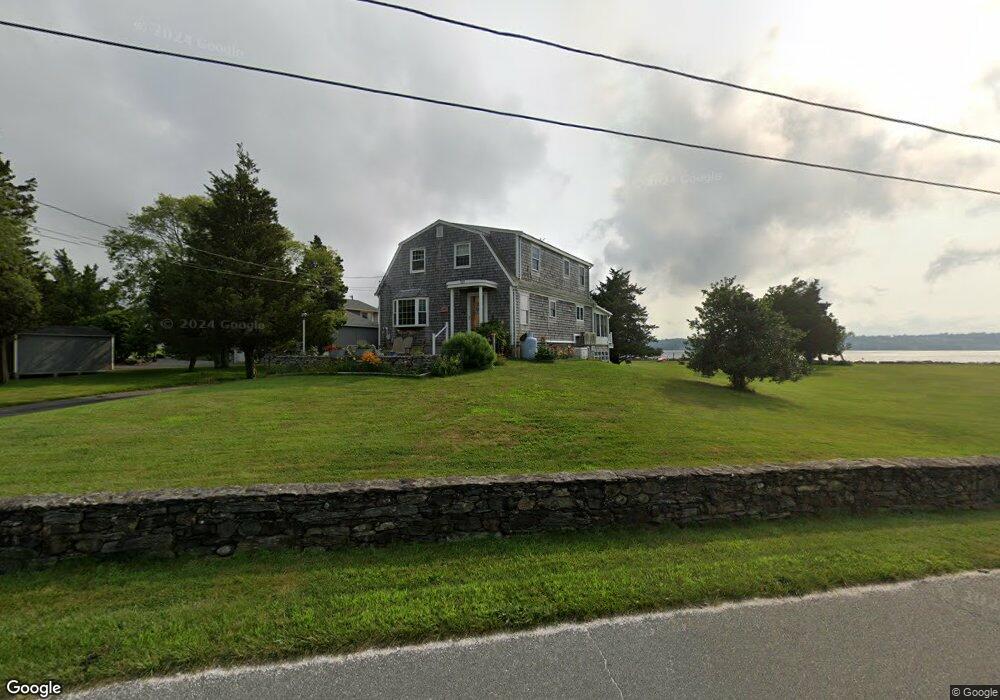
723 Seapowet Ave Tiverton, RI 02878
South Tiverton NeighborhoodEstimated Value: $1,086,000 - $1,478,000
3
Beds
3
Baths
1,778
Sq Ft
$705/Sq Ft
Est. Value
About This Home
This home is located at 723 Seapowet Ave, Tiverton, RI 02878 and is currently estimated at $1,254,024, approximately $705 per square foot. 723 Seapowet Ave is a home located in Newport County with nearby schools including Tiverton High School.
Ownership History
Date
Name
Owned For
Owner Type
Purchase Details
Closed on
Oct 25, 2002
Sold by
Metcalf Arthur W and Metcalf Blanche
Bought by
Metcalf Richard and Metcalf Kathleen
Current Estimated Value
Home Financials for this Owner
Home Financials are based on the most recent Mortgage that was taken out on this home.
Original Mortgage
$300,000
Interest Rate
6.2%
Create a Home Valuation Report for This Property
The Home Valuation Report is an in-depth analysis detailing your home's value as well as a comparison with similar homes in the area
Home Values in the Area
Average Home Value in this Area
Purchase History
| Date | Buyer | Sale Price | Title Company |
|---|---|---|---|
| Metcalf Richard | $300,000 | -- |
Source: Public Records
Mortgage History
| Date | Status | Borrower | Loan Amount |
|---|---|---|---|
| Open | Metcalf Richard | $262,000 | |
| Closed | Metcalf Richard | $300,000 |
Source: Public Records
Tax History Compared to Growth
Tax History
| Year | Tax Paid | Tax Assessment Tax Assessment Total Assessment is a certain percentage of the fair market value that is determined by local assessors to be the total taxable value of land and additions on the property. | Land | Improvement |
|---|---|---|---|---|
| 2025 | $13,584 | $1,229,300 | $918,100 | $311,200 |
| 2024 | $13,584 | $1,229,300 | $918,100 | $311,200 |
| 2023 | $13,231 | $888,000 | $699,400 | $188,600 |
| 2022 | $12,991 | $888,000 | $699,400 | $188,600 |
| 2021 | $12,602 | $883,100 | $699,400 | $183,700 |
| 2020 | $13,894 | $858,200 | $698,100 | $160,100 |
| 2019 | $13,551 | $858,200 | $698,100 | $160,100 |
| 2018 | $14,066 | $858,200 | $698,100 | $160,100 |
| 2017 | $15,981 | $838,900 | $698,100 | $140,800 |
| 2016 | $16,057 | $838,900 | $698,100 | $140,800 |
| 2015 | $16,057 | $838,900 | $698,100 | $140,800 |
| 2014 | $16,523 | $856,100 | $721,400 | $134,700 |
Source: Public Records
Map
Nearby Homes
- 30 Driftwood Dr
- 701 Seapowet Ave
- 47 Driftwood Dr
- 465 Seapowet Ave
- 52 Driftwood Dr
- 61 Driftwood Dr
- 62 Driftwood Dr
- 801 Seapowet Ave
- 71 Driftwood Dr
- 72 Driftwood Dr
- 81 Driftwood Dr
- 80 Driftwood Dr
- 815 Seapowet Ave
- 91 Driftwood Dr
- 98 Driftwood Dr
- 843 Seapowet Ave
- 857 Seapowet Ave
- 111 Driftwood Dr
- 108 Driftwood Dr
- 121 Driftwood Dr