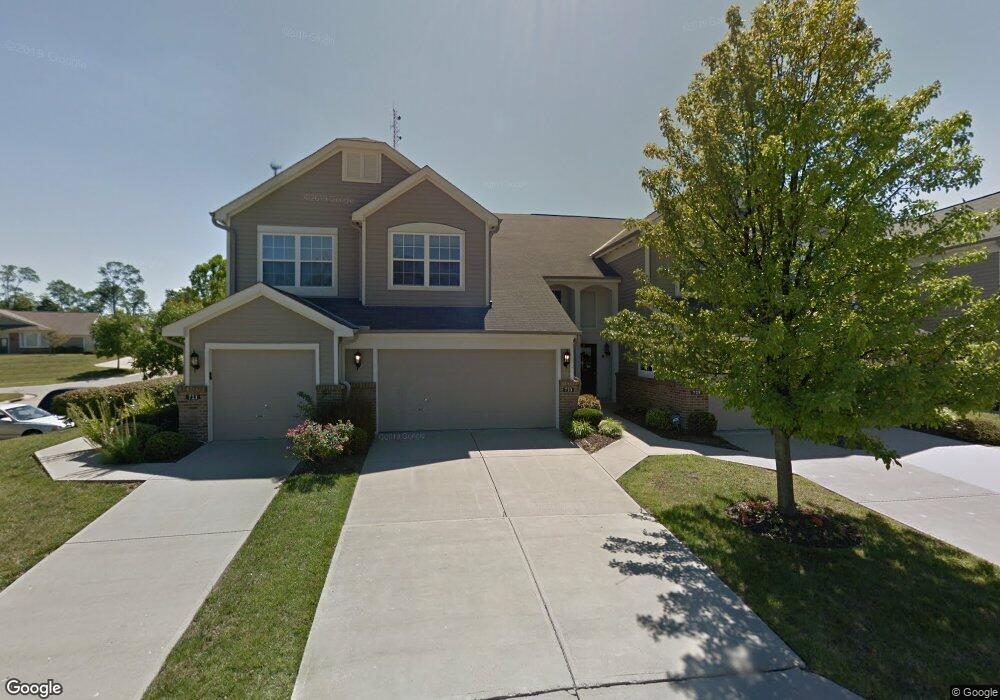
723 Southmeadow Cir Unit 36301 Cincinnati, OH 45231
Finneytown NeighborhoodEstimated Value: $264,000 - $301,000
3
Beds
3
Baths
1,869
Sq Ft
$151/Sq Ft
Est. Value
About This Home
This home is located at 723 Southmeadow Cir Unit 36301, Cincinnati, OH 45231 and is currently estimated at $281,351, approximately $150 per square foot. 723 Southmeadow Cir Unit 36301 is a home located in Hamilton County with nearby schools including Finneytown Elementary School, Finneytown Secondary Campus, and St. Vivian School.
Ownership History
Date
Name
Owned For
Owner Type
Purchase Details
Closed on
Jul 12, 2024
Sold by
Herzog Family Trust and Herzog Matthew
Bought by
Ashton Donna Lee and Ashton Nicole
Current Estimated Value
Purchase Details
Closed on
Jan 21, 2008
Sold by
Herzog Earl T and Herzog Karen Sue
Bought by
Herzog Earl T and Herzog Karen S
Purchase Details
Closed on
Dec 26, 2002
Sold by
Leeser Audrey
Bought by
Herzog Earl T and Herzog Karen Sue
Home Financials for this Owner
Home Financials are based on the most recent Mortgage that was taken out on this home.
Original Mortgage
$144,000
Interest Rate
6.13%
Mortgage Type
Balloon
Purchase Details
Closed on
Aug 8, 2001
Sold by
Fischer Attached Homes Ltd
Bought by
Leeser Audrey
Home Financials for this Owner
Home Financials are based on the most recent Mortgage that was taken out on this home.
Original Mortgage
$70,000
Interest Rate
7.28%
Create a Home Valuation Report for This Property
The Home Valuation Report is an in-depth analysis detailing your home's value as well as a comparison with similar homes in the area
Home Values in the Area
Average Home Value in this Area
Purchase History
| Date | Buyer | Sale Price | Title Company |
|---|---|---|---|
| Ashton Donna Lee | $280,000 | None Listed On Document | |
| Herzog Earl T | -- | Attorney | |
| Herzog Earl T | $180,000 | Vintage Title Agency Inc | |
| Leeser Audrey | $171,600 | Homestead Title Agency Inc |
Source: Public Records
Mortgage History
| Date | Status | Borrower | Loan Amount |
|---|---|---|---|
| Previous Owner | Herzog Earl T | $144,000 | |
| Previous Owner | Leeser Audrey | $70,000 |
Source: Public Records
Tax History Compared to Growth
Tax History
| Year | Tax Paid | Tax Assessment Tax Assessment Total Assessment is a certain percentage of the fair market value that is determined by local assessors to be the total taxable value of land and additions on the property. | Land | Improvement |
|---|---|---|---|---|
| 2024 | $3,659 | $63,861 | $8,960 | $54,901 |
| 2023 | $3,652 | $63,861 | $8,960 | $54,901 |
| 2022 | $3,816 | $50,208 | $6,832 | $43,376 |
| 2021 | $3,727 | $50,208 | $6,832 | $43,376 |
| 2020 | $3,809 | $50,208 | $6,832 | $43,376 |
| 2019 | $3,219 | $41,153 | $5,600 | $35,553 |
| 2018 | $2,972 | $41,153 | $5,600 | $35,553 |
| 2017 | $2,820 | $41,153 | $5,600 | $35,553 |
| 2016 | $2,828 | $40,786 | $4,368 | $36,418 |
| 2015 | $2,853 | $40,786 | $4,368 | $36,418 |
| 2014 | $2,862 | $40,786 | $4,368 | $36,418 |
| 2013 | $3,767 | $52,290 | $5,600 | $46,690 |
Source: Public Records
Map
Nearby Homes
- 801 Southmeadow Cir
- 869 Southmeadow Cir Unit 40203
- 810 Southmeadow Cir
- 840 Southmeadow Cir
- 685 Bridle Path
- 715 Castlegate Ln
- 720 Castlegate Ln
- 7865 Ramble View
- 7423 View Place Dr
- 6837 Warder Dr
- 557 W North Bend Rd
- 517 Wellesley Ave
- 939 Timber Trail
- 7113 Greenfringe Ln
- 8405 Arundel Ct
- 654 Doepke Ln
- 984 W Galbraith Rd
- 966 W North Bend Rd
- 1025 Eastgate Dr
- 8608 Long Ln
- 733 Southmeadow Cir
- 727 Southmeadow Cir Unit 36202
- 733 Southmeadow Cir Unit 36304
- 725 Southmeadow Cir Unit 36302
- 721 Southmeadow Cir Unit 36201
- 729 Southmeadow Cir Unit 36203
- 731 Southmeadow Cir Unit 36303
- 735 Southmeadow Cir
- 723 Southmeadow Cir Unit 36301
- 727 Southmeadow Cir Unit 36202
- 733 Southmeadow Cir Unit 36304
- 725 Southmeadow Cir Unit 36302
- 721 Southmeadow Cir Unit 36201
- 729 Southmeadow Cir Unit 36203
- 731 Southmeadow Cir Unit 36303
- 735 Southmeadow Cir Unit 36204
- 725 Southmeadow Cir
- 729 Southmeadow Cir
- 721 Southmeadow Cir
- 733 Southmeadow Cir