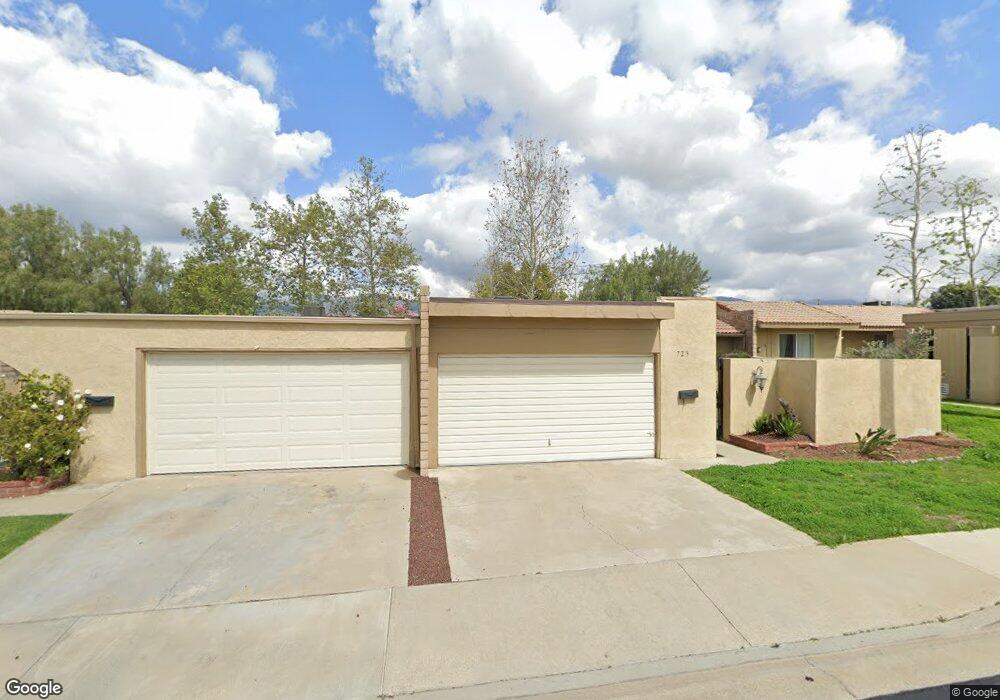
723 Via Los Santos San Dimas, CA 91773
Estimated Value: $604,000 - $664,000
3
Beds
2
Baths
1,323
Sq Ft
$478/Sq Ft
Est. Value
About This Home
This home is located at 723 Via Los Santos, San Dimas, CA 91773 and is currently estimated at $632,001, approximately $477 per square foot. 723 Via Los Santos is a home located in Los Angeles County with nearby schools including Grace Miller Elementary School, Lone Hill Middle School, and San Dimas High School.
Ownership History
Date
Name
Owned For
Owner Type
Purchase Details
Closed on
Sep 14, 2020
Sold by
Huston Deborah S and The Deborah S Huston Trust
Bought by
Maclean Bruce A and Phackdy Keonoi
Current Estimated Value
Home Financials for this Owner
Home Financials are based on the most recent Mortgage that was taken out on this home.
Original Mortgage
$415,299
Outstanding Balance
$368,550
Interest Rate
2.9%
Mortgage Type
New Conventional
Estimated Equity
$263,451
Purchase Details
Closed on
May 16, 2019
Sold by
Ingram Jeffrey A and The Joan Ingram Trust
Bought by
Ingram Jeffrey A
Purchase Details
Closed on
May 13, 2019
Sold by
Ingram Jeffrey A
Bought by
Huston Deborah S and The Deborah S Huston Trust
Purchase Details
Closed on
May 24, 2017
Sold by
Ingram Jeffrey A
Bought by
Ingram Jeffrey A
Purchase Details
Closed on
Oct 20, 1998
Sold by
Ingram Joan M
Bought by
Ingram Joan and The Joan Ingram Living Trust
Create a Home Valuation Report for This Property
The Home Valuation Report is an in-depth analysis detailing your home's value as well as a comparison with similar homes in the area
Home Values in the Area
Average Home Value in this Area
Purchase History
| Date | Buyer | Sale Price | Title Company |
|---|---|---|---|
| Maclean Bruce A | $410,000 | Lawyers Title Company | |
| Ingram Jeffrey A | -- | Lawyers Title | |
| Huston Deborah S | $405,000 | Lawyers Title Company | |
| Ingram Jeffrey A | -- | None Available | |
| Ingram Joan | -- | -- |
Source: Public Records
Mortgage History
| Date | Status | Borrower | Loan Amount |
|---|---|---|---|
| Open | Maclean Bruce A | $415,299 |
Source: Public Records
Tax History Compared to Growth
Tax History
| Year | Tax Paid | Tax Assessment Tax Assessment Total Assessment is a certain percentage of the fair market value that is determined by local assessors to be the total taxable value of land and additions on the property. | Land | Improvement |
|---|---|---|---|---|
| 2025 | $5,873 | $490,665 | $243,871 | $246,794 |
| 2024 | $5,873 | $481,045 | $239,090 | $241,955 |
| 2023 | $5,740 | $471,613 | $234,402 | $237,211 |
| 2022 | $5,643 | $462,366 | $229,806 | $232,560 |
| 2021 | $5,532 | $453,300 | $225,300 | $228,000 |
| 2020 | $5,042 | $405,000 | $205,000 | $200,000 |
| 2019 | $1,184 | $65,220 | $13,154 | $52,066 |
| 2018 | $1,095 | $63,943 | $12,897 | $51,046 |
| 2016 | $1,039 | $61,463 | $12,398 | $49,065 |
| 2015 | $1,026 | $60,540 | $12,212 | $48,328 |
| 2014 | $1,027 | $59,355 | $11,973 | $47,382 |
Source: Public Records
Map
Nearby Homes
- 2206 Stratford Way
- 840 Bonita Ave
- 208 S Gaffney Ave
- 808 Arbor Cir
- 518 Willow Place
- 1301 3rd St
- 1770 Van Dusen Rd
- 2729 Sedalia Ave
- 624 E Payson St
- 610 E Payson St
- 727 Glenlea St
- 402 E De Anza Heights Dr
- 748 S Walnut Ave
- 612 N Oceanbluff Ave
- 751 Harwood Ct
- 1117 Gladstone St
- 208 E 3rd St
- 1554 3rd St
- 429 E Gladstone St
- 740 N Delancey Ave
- 727 Via Los Santos
- 721 Via Los Santos
- 729 Via Los Santos
- 717 Via Los Santos
- 733 Via Los Santos
- 724 Via Los Santos
- 726 Via Los Santos
- 720 Via Los Santos
- 740 Via Los Santos
- 735 Via Los Santos
- 713 Via Los Santos
- 718 Via Los Santos
- 742 Via Los Santos
- 739 Via Los Santos
- 711 Via Los Santos
- 714 Via Los Santos
- 770 Via Los Santos
- 748 Via Los Santos
- 768 Via Los Santos
- 741 Via Los Santos