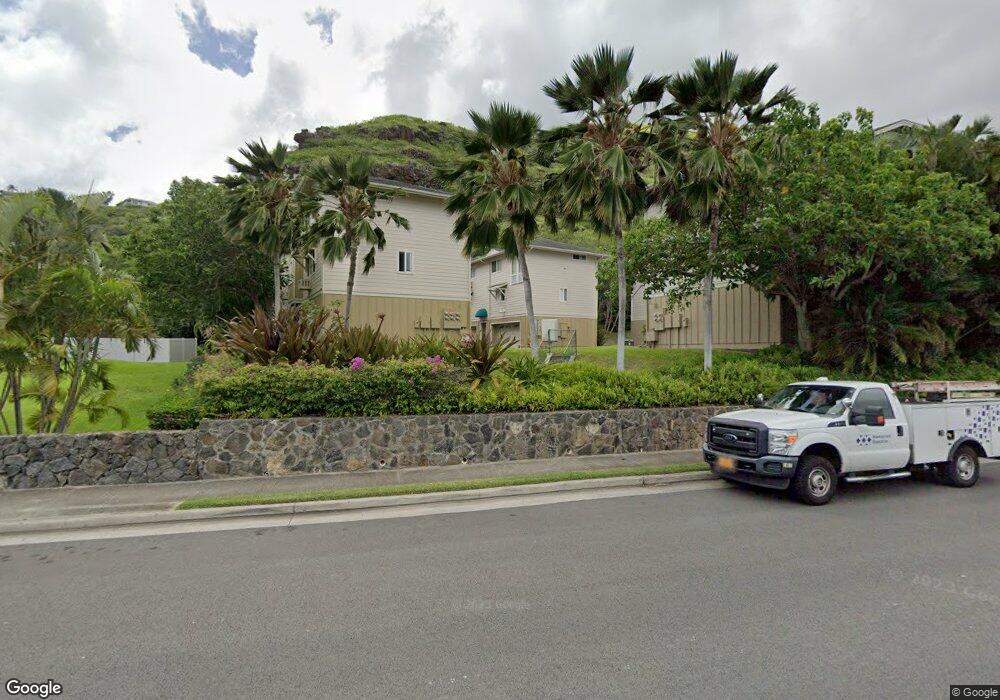
7230 Hawaii Kai Dr Unit C Honolulu, HI 96825
Hawaii Kai NeighborhoodEstimated Value: $791,000 - $869,000
2
Beds
2
Baths
952
Sq Ft
$864/Sq Ft
Est. Value
About This Home
This home is located at 7230 Hawaii Kai Dr Unit C, Honolulu, HI 96825 and is currently estimated at $822,556, approximately $864 per square foot. 7230 Hawaii Kai Dr Unit C is a home located in Honolulu County with nearby schools including Haha'ione Elementary School, Niu Valley Middle School, and Honolulu Waldorf School.
Ownership History
Date
Name
Owned For
Owner Type
Purchase Details
Closed on
Sep 22, 2025
Sold by
Samson Salvador Antonio
Bought by
Pang John-Brandon and Benanua-Pang Gerralynn
Current Estimated Value
Home Financials for this Owner
Home Financials are based on the most recent Mortgage that was taken out on this home.
Original Mortgage
$745,750
Outstanding Balance
$745,750
Interest Rate
6.58%
Mortgage Type
New Conventional
Estimated Equity
$76,806
Purchase Details
Closed on
Sep 26, 2001
Sold by
Rym Hawaii Kai Venture
Bought by
Samson Salvador Antonio
Home Financials for this Owner
Home Financials are based on the most recent Mortgage that was taken out on this home.
Original Mortgage
$210,550
Interest Rate
6.84%
Create a Home Valuation Report for This Property
The Home Valuation Report is an in-depth analysis detailing your home's value as well as a comparison with similar homes in the area
Home Values in the Area
Average Home Value in this Area
Purchase History
| Date | Buyer | Sale Price | Title Company |
|---|---|---|---|
| Pang John-Brandon | $765,000 | Old Republic Title | |
| Samson Salvador Antonio | $263,200 | Title Guaranty Escrow Servic |
Source: Public Records
Mortgage History
| Date | Status | Borrower | Loan Amount |
|---|---|---|---|
| Open | Pang John-Brandon | $745,750 | |
| Previous Owner | Samson Salvador Antonio | $210,550 |
Source: Public Records
Tax History Compared to Growth
Tax History
| Year | Tax Paid | Tax Assessment Tax Assessment Total Assessment is a certain percentage of the fair market value that is determined by local assessors to be the total taxable value of land and additions on the property. | Land | Improvement |
|---|---|---|---|---|
| 2025 | $2,636 | $892,100 | $712,700 | $179,400 |
| 2024 | $2,636 | $753,100 | $712,700 | $40,400 |
| 2023 | $2,623 | $749,500 | $712,700 | $36,800 |
| 2022 | $2,595 | $741,300 | $610,900 | $130,400 |
| 2021 | $2,387 | $682,100 | $572,700 | $109,400 |
| 2020 | $2,485 | $709,900 | $572,700 | $137,200 |
| 2019 | $2,450 | $700,100 | $560,000 | $140,100 |
| 2018 | $2,221 | $634,500 | $458,200 | $176,300 |
| 2017 | $2,183 | $623,600 | $356,400 | $267,200 |
| 2016 | $2,043 | $583,800 | $310,500 | $273,300 |
| 2015 | $1,828 | $522,200 | $300,400 | $221,800 |
| 2014 | $1,516 | $524,200 | $299,800 | $224,400 |
Source: Public Records
Map
Nearby Homes
- 7160 Hawaii Kai Dr Unit 216
- 580 Lunalilo Home Rd Unit B3403
- 580 Lunalilo Home Rd Unit 345
- 646 Waikanaloa St
- 7227 Pikoni Place
- 7223 Naohe St
- 7007 Hawaii Kai Dr Unit A24
- 7007 Hawaii Kai Dr Unit E12
- 7007 Hawaii Kai Dr Unit J25
- 7007 Hawaii Kai Dr Unit A16
- 7007 Hawaii Kai Dr Unit L22
- 7012 Hawaii Kai Dr Unit 205
- 7012 Hawaii Kai Dr Unit 207
- 1048 Kaupaku Place
- 6710 Hawaii Kai Dr Unit 704
- 6710 Hawaii Kai Dr Unit 1704
- 521 Hahaione St Unit 22L
- 501 Hahaione St Unit 2
- 501 Hahaione St Unit 1/17H
- 521 Hahaione St Unit 215L
- 7230 Hawaii Kai Dr Unit F
- 7230 Hawaii Kai Dr Unit 7230E
- 7232 Hawaii Kai Dr Unit B
- 7238 Hawaii Kai Dr Unit B
- 7238 Hawaii Kai Dr Unit C
- 7238 Hawaii Kai Dr Unit D
- 7238 Hawaii Kai Dr Unit A
- 7232 Hawaii Kai Dr Unit D
- 7232 Hawaii Kai Dr Unit C
- 7230 Hawaii Kai Dr Unit D
- 7230 Hawaii Kai Dr Unit B
- 7230 Hawaii Kai Dr Unit A
- 7232 Hawaii Kai Dr Unit 7232A
- 7232 Hawaii Kai Dr Unit B
- 7236 Hawaii Kai Dr Unit A
- 7236 Hawaii Kai Dr Unit F
- 7236 Hawaii Kai Dr Unit E
- 7236 Hawaii Kai Dr Unit D
- 7236 Hawaii Kai Dr Unit C
- 7236 Hawaii Kai Dr Unit B