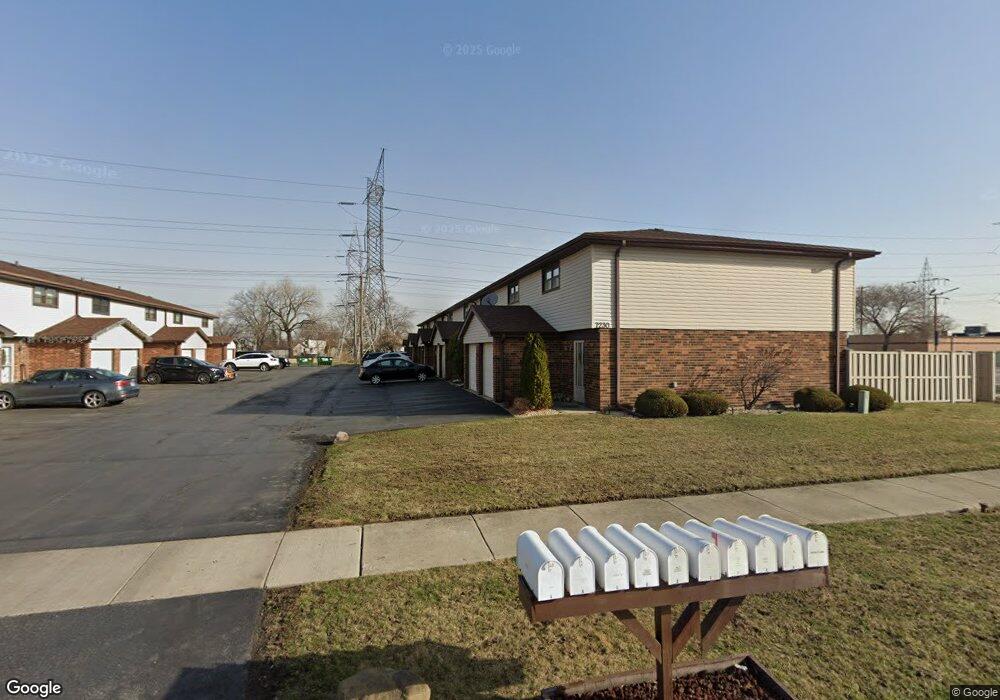
7230 W 84th St Unit C Bridgeview, IL 60455
Estimated Value: $180,000 - $191,000
2
Beds
2
Baths
27,280
Sq Ft
$7/Sq Ft
Est. Value
About This Home
This home is located at 7230 W 84th St Unit C, Bridgeview, IL 60455 and is currently estimated at $184,646, approximately $6 per square foot. 7230 W 84th St Unit C is a home located in Cook County with nearby schools including Bridgeview Elementary School, Argo Community High School, and Aqsa School.
Ownership History
Date
Name
Owned For
Owner Type
Purchase Details
Closed on
Dec 28, 2007
Sold by
Salas Maricela
Bought by
Kieronski Pawel and Kieronska Teresa
Current Estimated Value
Home Financials for this Owner
Home Financials are based on the most recent Mortgage that was taken out on this home.
Original Mortgage
$160,000
Outstanding Balance
$99,732
Interest Rate
6.27%
Mortgage Type
Purchase Money Mortgage
Estimated Equity
$84,914
Purchase Details
Closed on
May 5, 2003
Sold by
Knouse Michael and Knouse Melissa
Bought by
Salas Maricela
Home Financials for this Owner
Home Financials are based on the most recent Mortgage that was taken out on this home.
Original Mortgage
$65,000
Interest Rate
5.87%
Mortgage Type
Purchase Money Mortgage
Purchase Details
Closed on
Jan 1, 1998
Sold by
Manning Jane F
Bought by
Knouse Michael J and Knouse Melissa A
Home Financials for this Owner
Home Financials are based on the most recent Mortgage that was taken out on this home.
Original Mortgage
$81,200
Interest Rate
7.24%
Mortgage Type
FHA
Create a Home Valuation Report for This Property
The Home Valuation Report is an in-depth analysis detailing your home's value as well as a comparison with similar homes in the area
Home Values in the Area
Average Home Value in this Area
Purchase History
| Date | Buyer | Sale Price | Title Company |
|---|---|---|---|
| Kieronski Pawel | $160,000 | Ticor Title Insurance Co | |
| Salas Maricela | $125,000 | Stewart Title | |
| Salas Maricela | $125,000 | Stewart Title | |
| Knouse Michael J | $81,500 | -- |
Source: Public Records
Mortgage History
| Date | Status | Borrower | Loan Amount |
|---|---|---|---|
| Open | Kieronski Pawel | $160,000 | |
| Previous Owner | Salas Maricela | $65,000 | |
| Previous Owner | Knouse Michael J | $81,200 |
Source: Public Records
Tax History
| Year | Tax Paid | Tax Assessment Tax Assessment Total Assessment is a certain percentage of the fair market value that is determined by local assessors to be the total taxable value of land and additions on the property. | Land | Improvement |
|---|---|---|---|---|
| 2025 | $3,162 | $12,480 | $1,005 | $11,475 |
| 2024 | $3,162 | $12,480 | $1,005 | $11,475 |
| 2023 | $2,668 | $12,480 | $1,005 | $11,475 |
| 2022 | $2,668 | $10,097 | $2,344 | $7,753 |
| 2021 | $2,608 | $10,095 | $2,343 | $7,752 |
| 2020 | $2,611 | $10,095 | $2,343 | $7,752 |
| 2019 | $1,924 | $8,099 | $2,120 | $5,979 |
| 2018 | $1,837 | $8,099 | $2,120 | $5,979 |
| 2017 | $1,823 | $8,099 | $2,120 | $5,979 |
| 2016 | $2,146 | $7,738 | $1,841 | $5,897 |
| 2015 | $1,984 | $7,738 | $1,841 | $5,897 |
| 2014 | $1,938 | $7,738 | $1,841 | $5,897 |
| 2013 | $2,335 | $9,479 | $1,841 | $7,638 |
Source: Public Records
Map
Nearby Homes
- 7234 W 85th St
- 7132 W 84th Place
- 7329 W 85th Place Unit 2A
- 7242 W 86th St Unit 3A
- 7110 W 82nd Place
- 8101 S Oketo Ave
- 8233 S 76th Ave
- 8800 S Harlem Ave Unit 2311
- 8800 S Harlem Ave Unit 2111
- 8800 S Harlem Ave Unit 326
- 8800 S Harlem Ave Unit 1127
- 8800 S Harlem Ave Unit 2000A
- 8632 New England Ave
- 8808 Cranbrook Ln
- 7700 W 83rd St
- 7347 W 79th Place Unit 2D
- 8053 Newland Ave
- 6896 W 87th St Unit 3W
- 7945 S Oketo Ave Unit 404
- 7945 S Oketo Ave Unit 408
- 7230 W 84th St Unit 7230B
- 7230 W 84th St Unit 7230G
- 7230 W 84th St Unit 7230C
- 7230 W 84th St Unit 7230E
- 7230 W 84th St Unit 7230H
- 7230 W 84th St Unit 7230F
- 7230 W 84th St Unit 7230D
- 7230 W 84th St Unit 7230I
- 7230 W 84th St Unit 7230A
- 7230 W 84th St Unit H
- 7230 W 84th St Unit G
- 7230 W 84th St Unit D
- 7240 W 84th St Unit 7240G
- 7240 W 84th St Unit 7240B
- 7240 W 84th St Unit 7240E
- 7240 W 84th St Unit 7240F
- 7240 W 84th St Unit 7240A
- 7240 W 84th St Unit 7240D
- 7240 W 84th St Unit 7240C
- 7240 W 84th St Unit G
Your Personal Tour Guide
Ask me questions while you tour the home.