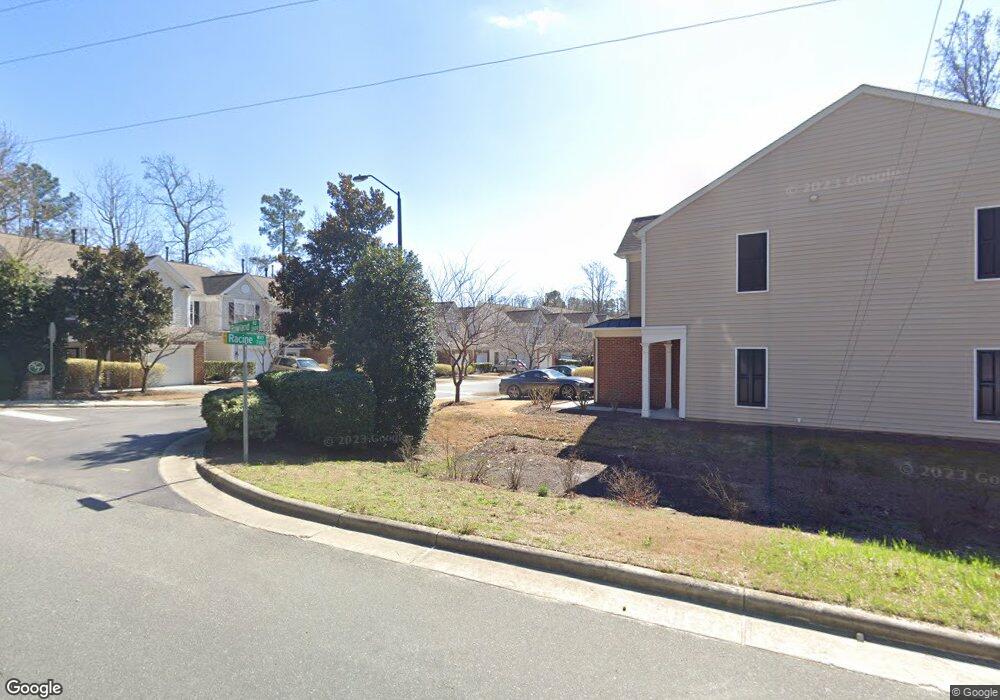
7232 Racine Way Raleigh, NC 27615
North Ridge NeighborhoodEstimated Value: $302,297 - $338,000
3
Beds
3
Baths
1,611
Sq Ft
$203/Sq Ft
Est. Value
About This Home
This home is located at 7232 Racine Way, Raleigh, NC 27615 and is currently estimated at $326,324, approximately $202 per square foot. 7232 Racine Way is a home located in Wake County with nearby schools including North Ridge Elementary School, West Millbrook Middle School, and Millbrook High School.
Ownership History
Date
Name
Owned For
Owner Type
Purchase Details
Closed on
May 14, 2018
Sold by
Jones David Harrison and Jones Ashley
Bought by
Liu Yang and Cai Jiaozhong
Current Estimated Value
Home Financials for this Owner
Home Financials are based on the most recent Mortgage that was taken out on this home.
Original Mortgage
$120,000
Outstanding Balance
$103,419
Interest Rate
4.44%
Mortgage Type
New Conventional
Estimated Equity
$222,905
Purchase Details
Closed on
Sep 6, 2013
Sold by
Marslender Michelle C
Bought by
Jones David Harrison
Home Financials for this Owner
Home Financials are based on the most recent Mortgage that was taken out on this home.
Original Mortgage
$6,136,800
Interest Rate
3.25%
Mortgage Type
Adjustable Rate Mortgage/ARM
Purchase Details
Closed on
Oct 31, 2007
Sold by
Pulte Home Corp
Bought by
Marslender Michelle C
Home Financials for this Owner
Home Financials are based on the most recent Mortgage that was taken out on this home.
Original Mortgage
$128,480
Interest Rate
6.27%
Mortgage Type
Unknown
Create a Home Valuation Report for This Property
The Home Valuation Report is an in-depth analysis detailing your home's value as well as a comparison with similar homes in the area
Home Values in the Area
Average Home Value in this Area
Purchase History
| Date | Buyer | Sale Price | Title Company |
|---|---|---|---|
| Liu Yang | $205,500 | None Available | |
| Jones David Harrison | $152,000 | None Available | |
| Marslender Michelle C | $161,000 | None Available |
Source: Public Records
Mortgage History
| Date | Status | Borrower | Loan Amount |
|---|---|---|---|
| Open | Liu Yang | $120,000 | |
| Previous Owner | Jones David Harrison | $6,136,800 | |
| Previous Owner | Marslender Michelle C | $128,480 |
Source: Public Records
Tax History Compared to Growth
Tax History
| Year | Tax Paid | Tax Assessment Tax Assessment Total Assessment is a certain percentage of the fair market value that is determined by local assessors to be the total taxable value of land and additions on the property. | Land | Improvement |
|---|---|---|---|---|
| 2025 | $2,654 | $302,078 | $59,500 | $242,578 |
| 2024 | $2,644 | $302,078 | $59,500 | $242,578 |
| 2023 | $2,380 | $216,526 | $50,000 | $166,526 |
| 2022 | $2,212 | $216,526 | $50,000 | $166,526 |
| 2021 | $2,127 | $216,526 | $50,000 | $166,526 |
| 2020 | $2,088 | $216,526 | $50,000 | $166,526 |
| 2019 | $1,953 | $166,807 | $40,000 | $126,807 |
| 2018 | $1,843 | $166,807 | $40,000 | $126,807 |
| 2017 | $1,755 | $166,807 | $40,000 | $126,807 |
| 2016 | $1,719 | $166,807 | $40,000 | $126,807 |
| 2015 | $1,964 | $187,721 | $42,000 | $145,721 |
| 2014 | $1,863 | $187,721 | $42,000 | $145,721 |
Source: Public Records
Map
Nearby Homes
- 7008 Racine Way
- 7015 Litchford Rd
- 7019 Litchford Rd
- 2205 Landings Way
- 6921 Hunters Way
- 2328 Florida Ct
- 2317 Declaration Dr
- 2353 Florida Ct
- 7316 Massachusetts Ct
- 2516 Constitution Dr
- 2301 Upper Oaks Way
- 1925 Hunting Ridge Rd
- 6904 Aspen Ct
- 2105 Prescott Place
- 2920 Berkeley Springs Place
- 6617 Clarksburg Place
- 6311 Johnsdale Rd
- 6626 Clarksburg Place
- 3002 Berkeley Springs Place
- 6613 Morgantown St
- 7240 Racine Way
- 7230 Racine Way
- 7242 Racine Way
- 7228 Racine Way
- 7244 Racine Way
- 7226 Racine Way
- 7246 Racine Way
- 7241 Racine Way
- 7224 Racine Way
- 7248 Racine Way
- 7243 Racine Way
- 7222 Racine Way
- 7250 Racine Way
- 7245 Racine Way
- 7220 Racine Way
- 7249 Racine Way
- 7012 Racine Way
- 7010 Racine Way
- 2104 Goudy Dr
- 2106 Goudy Dr