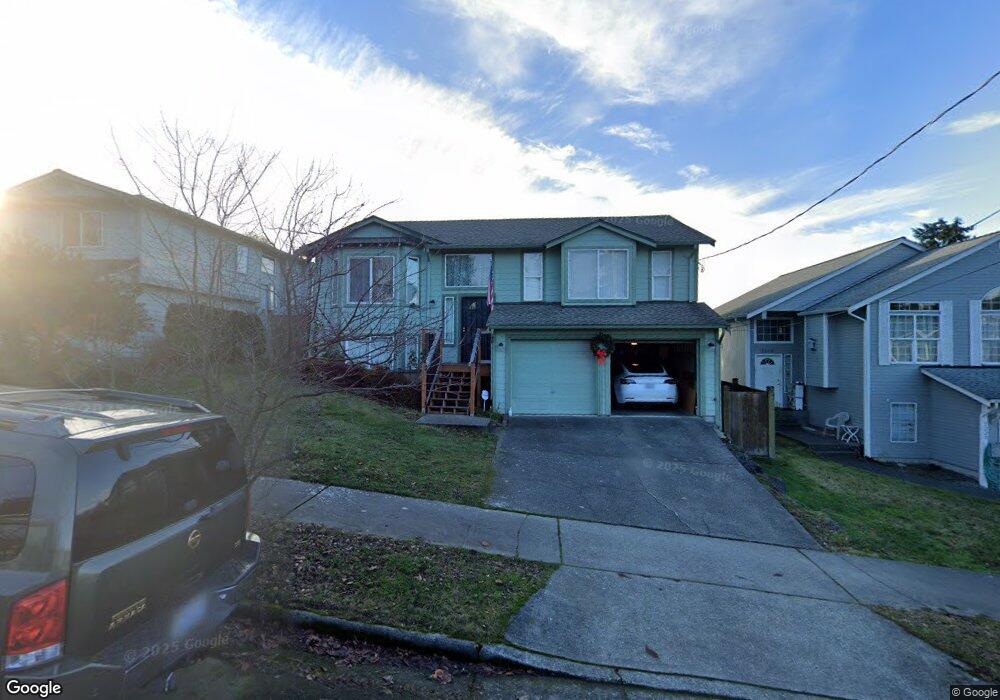
7233 17th Ave SW Seattle, WA 98106
Riverview NeighborhoodEstimated Value: $836,946 - $987,000
4
Beds
3
Baths
1,310
Sq Ft
$672/Sq Ft
Est. Value
About This Home
This home is located at 7233 17th Ave SW, Seattle, WA 98106 and is currently estimated at $880,487, approximately $672 per square foot. 7233 17th Ave SW is a home located in King County with nearby schools including Sanislo Elementary School, Denny Middle School, and Chief Sealth High School.
Ownership History
Date
Name
Owned For
Owner Type
Purchase Details
Closed on
Sep 6, 2002
Sold by
Vanle Hoang
Bought by
Canlas Arnel C and Canlas Glenda E
Current Estimated Value
Home Financials for this Owner
Home Financials are based on the most recent Mortgage that was taken out on this home.
Original Mortgage
$247,500
Outstanding Balance
$104,370
Interest Rate
6.37%
Estimated Equity
$776,117
Purchase Details
Closed on
Sep 17, 2001
Sold by
Vanduong Ba
Bought by
Vanle Hoang
Purchase Details
Closed on
Jan 18, 1996
Sold by
Powell Home Builders Inc
Bought by
Vanvanle Hoang Van and Duong Ba Van
Home Financials for this Owner
Home Financials are based on the most recent Mortgage that was taken out on this home.
Original Mortgage
$123,950
Interest Rate
6.99%
Create a Home Valuation Report for This Property
The Home Valuation Report is an in-depth analysis detailing your home's value as well as a comparison with similar homes in the area
Home Values in the Area
Average Home Value in this Area
Purchase History
| Date | Buyer | Sale Price | Title Company |
|---|---|---|---|
| Canlas Arnel C | $275,000 | Stewart Title | |
| Vanle Hoang | -- | Transnation Title | |
| Vanvanle Hoang Van | $169,450 | Stewart Title |
Source: Public Records
Mortgage History
| Date | Status | Borrower | Loan Amount |
|---|---|---|---|
| Open | Canlas Arnel C | $247,500 | |
| Previous Owner | Vanvanle Hoang Van | $123,950 |
Source: Public Records
Tax History Compared to Growth
Tax History
| Year | Tax Paid | Tax Assessment Tax Assessment Total Assessment is a certain percentage of the fair market value that is determined by local assessors to be the total taxable value of land and additions on the property. | Land | Improvement |
|---|---|---|---|---|
| 2024 | $7,570 | $738,000 | $313,000 | $425,000 |
| 2023 | $6,445 | $675,000 | $277,000 | $398,000 |
| 2022 | $5,745 | $709,000 | $252,000 | $457,000 |
| 2021 | $5,282 | $577,000 | $202,000 | $375,000 |
| 2020 | $5,098 | $501,000 | $179,000 | $322,000 |
| 2018 | $4,414 | $500,000 | $182,000 | $318,000 |
| 2017 | $3,802 | $410,000 | $152,000 | $258,000 |
| 2016 | $3,533 | $363,000 | $143,000 | $220,000 |
| 2015 | $2,969 | $330,000 | $129,000 | $201,000 |
| 2014 | -- | $281,000 | $116,000 | $165,000 |
| 2013 | -- | $247,000 | $116,000 | $131,000 |
Source: Public Records
Map
Nearby Homes
- 0 17th Ave SW
- 7169 18th Ave SW
- 7341 16th Ave SW
- 7023 16th Ave SW
- 7502 14th Ave SW
- 38 XX 21st Ave SW
- 6730 21st Ave SW
- 6968 24th Ave SW
- 7748 14th Ave SW
- 7749 17th Ave SW
- 1605 SW Kenyon St
- 1603 SW Kenyon St
- 7901 16th Ave SW
- 6740 17th Ave SW
- 2452 SW Webster St
- 2446 SW Webster St
- 2490 SW Webster St
- 6705 Delridge Way SW
- 7600 Highland Park Way SW
- 7162 Shinkle Place SW Unit 64
- 7229 17th Ave SW
- 7237 17th Ave SW
- 7225 17th Ave SW
- 7241 17th Ave SW
- 7164 18th Ave SW
- 7170 18th Ave SW
- 7160 18th Ave SW
- 7219 17th Ave SW
- 7247 17th Ave SW
- 7300 18th Ave SW
- 7247 17th Ave SW
- 7156 18th Ave SW
- 7230 17th Ave SW
- 7226 17th Ave SW
- 7236 17th Ave SW
- 7215 17th Ave SW
- 7220 17th Ave SW
- 7304 17th Ave SW
- 7312 18th Ave SW
- 7148 18th Ave SW