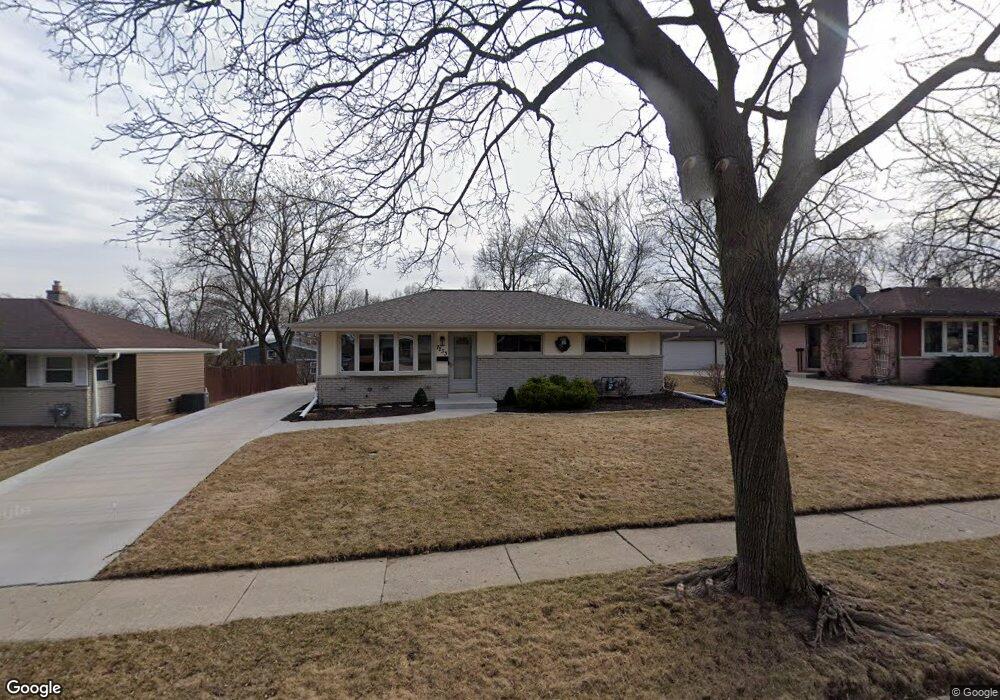
7233 Devonshire Ave Greendale, WI 53129
Estimated Value: $271,000 - $326,000
3
Beds
1
Bath
1,013
Sq Ft
$296/Sq Ft
Est. Value
About This Home
This home is located at 7233 Devonshire Ave, Greendale, WI 53129 and is currently estimated at $300,154, approximately $296 per square foot. 7233 Devonshire Ave is a home located in Milwaukee County with nearby schools including Canterbury Elementary School, Greendale Middle School, and Greendale High School.
Ownership History
Date
Name
Owned For
Owner Type
Purchase Details
Closed on
May 10, 2019
Sold by
Serketich Dana M
Bought by
Serketich Hayley R and Serketich Connor P
Current Estimated Value
Purchase Details
Closed on
Oct 19, 2016
Sold by
Husak Janis B
Bought by
Serketich Dana M
Home Financials for this Owner
Home Financials are based on the most recent Mortgage that was taken out on this home.
Original Mortgage
$116,500
Interest Rate
3.5%
Purchase Details
Closed on
Nov 19, 2014
Sold by
Podd Lois and Podd Lois M
Bought by
Husak Janis B
Home Financials for this Owner
Home Financials are based on the most recent Mortgage that was taken out on this home.
Original Mortgage
$118,000
Interest Rate
3.84%
Purchase Details
Closed on
Jul 16, 2003
Sold by
Podd Alvin Edward
Bought by
Podd Lois M
Create a Home Valuation Report for This Property
The Home Valuation Report is an in-depth analysis detailing your home's value as well as a comparison with similar homes in the area
Home Values in the Area
Average Home Value in this Area
Purchase History
| Date | Buyer | Sale Price | Title Company |
|---|---|---|---|
| Serketich Hayley R | -- | None Available | |
| Serketich Dana M | $147,500 | Attorney | |
| Husak Janis B | $147,500 | None Available | |
| Podd Lois M | -- | -- |
Source: Public Records
Mortgage History
| Date | Status | Borrower | Loan Amount |
|---|---|---|---|
| Previous Owner | Serketich Dana M | $116,500 | |
| Previous Owner | Husak Janis B | $118,000 |
Source: Public Records
Tax History
| Year | Tax Paid | Tax Assessment Tax Assessment Total Assessment is a certain percentage of the fair market value that is determined by local assessors to be the total taxable value of land and additions on the property. | Land | Improvement |
|---|---|---|---|---|
| 2024 | $4,258 | $248,900 | $66,100 | $182,800 |
| 2023 | $4,122 | $225,900 | $66,100 | $159,800 |
| 2022 | $4,164 | $225,900 | $66,100 | $159,800 |
| 2021 | $4,091 | $170,400 | $59,000 | $111,400 |
| 2020 | $4,121 | $170,400 | $59,000 | $111,400 |
| 2019 | $4,091 | $170,400 | $59,000 | $111,400 |
| 2018 | $4,446 | $170,400 | $59,000 | $111,400 |
| 2017 | $3,892 | $159,700 | $56,700 | $103,000 |
| 2016 | $3,859 | $159,700 | $56,700 | $103,000 |
| 2015 | $3,945 | $155,400 | $56,700 | $98,700 |
| 2014 | $3,918 | $155,400 | $56,700 | $98,700 |
| 2013 | $3,981 | $155,400 | $56,700 | $98,700 |
Source: Public Records
Map
Nearby Homes
- 5872 Riverside Dr
- 5623 Bentwood Ln
- 5458 Wild Cherry Cir
- 5316 Robin Dr
- 8866 Greenmeadow Ln
- 7179 W Rawson Ave Unit 135
- 5070 S 69th St
- 5350 W Yale Dr
- 8710 W Hawthorne Ln
- 5826 Sugarbush Ln
- 5255 W Princeton Dr
- 8621 W Midland Dr
- 8755 W Meadow Ln
- 5921 Sycamore St
- 7260 S Hillside Dr
- Lt2 S Ballpark Dr
- Lt1 S Ballpark Dr
- 4759 W Abbott Ave
- 5732 W Rawson Ave
- Lt7 Terrace Dr
- 7227 Devonshire Ave
- 7239 Devonshire Ave
- 7219 Devonshire Ave
- 7210 Dorchester Ln
- 7208 Dorchester Ln
- 7309 Devonshire Ave
- 7232 Devonshire Ave
- 7213 Devonshire Ave
- 7236 Devonshire Ave
- 7224 Devonshire Ave
- 7206 Dorchester Ln
- 7212 Dorchester Ln
- 7306 Devonshire Ave
- 7216 Devonshire Ave
- 7319 Devonshire Ave
- 7207 Devonshire Ave
- 7314 Devonshire Ave
- 7204 Dorchester Ln
- 7208 Devonshire Ave
- 7214 Dorchester Ln
Your Personal Tour Guide
Ask me questions while you tour the home.