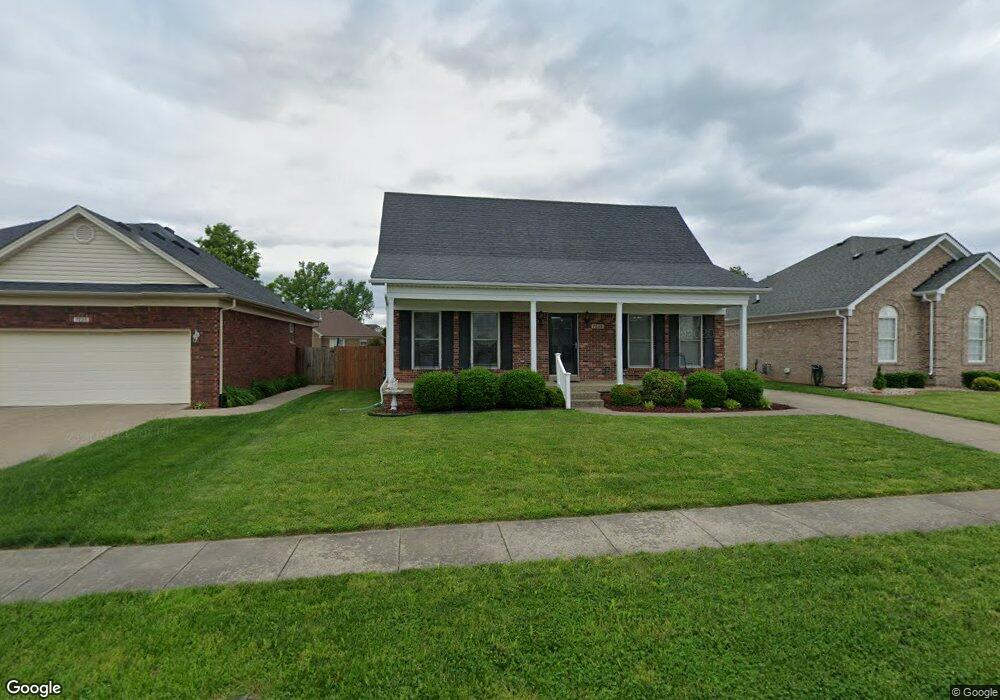
7233 Strive Ln Unit L 98 Louisville, KY 40258
Pleasure Ridge Park NeighborhoodEstimated Value: $339,511 - $379,000
4
Beds
2
Baths
1,801
Sq Ft
$196/Sq Ft
Est. Value
About This Home
This home is located at 7233 Strive Ln Unit L 98, Louisville, KY 40258 and is currently estimated at $353,128, approximately $196 per square foot. 7233 Strive Ln Unit L 98 is a home located in Jefferson County with nearby schools including Shacklette Elementary School, Wilkerson Elementary School, and Greenwood Elementary School.
Ownership History
Date
Name
Owned For
Owner Type
Purchase Details
Closed on
May 29, 2024
Sold by
Hickey David M and Hickey Kisha F
Bought by
Haidar Ahmed
Current Estimated Value
Home Financials for this Owner
Home Financials are based on the most recent Mortgage that was taken out on this home.
Original Mortgage
$314,204
Outstanding Balance
$310,345
Interest Rate
7.22%
Mortgage Type
FHA
Estimated Equity
$42,783
Purchase Details
Closed on
Nov 4, 2005
Sold by
Ken Thieneman Builders
Bought by
Hickey David M and Hickey Kisha F
Home Financials for this Owner
Home Financials are based on the most recent Mortgage that was taken out on this home.
Original Mortgage
$159,000
Interest Rate
5.84%
Mortgage Type
Purchase Money Mortgage
Create a Home Valuation Report for This Property
The Home Valuation Report is an in-depth analysis detailing your home's value as well as a comparison with similar homes in the area
Home Values in the Area
Average Home Value in this Area
Purchase History
| Date | Buyer | Sale Price | Title Company |
|---|---|---|---|
| Haidar Ahmed | $320,000 | Emerald Title Group | |
| Hickey David M | $189,000 | None Available |
Source: Public Records
Mortgage History
| Date | Status | Borrower | Loan Amount |
|---|---|---|---|
| Open | Haidar Ahmed | $314,204 | |
| Previous Owner | Hickey David M | $159,000 |
Source: Public Records
Tax History Compared to Growth
Tax History
| Year | Tax Paid | Tax Assessment Tax Assessment Total Assessment is a certain percentage of the fair market value that is determined by local assessors to be the total taxable value of land and additions on the property. | Land | Improvement |
|---|---|---|---|---|
| 2024 | $2,743 | $235,410 | $33,600 | $201,810 |
| 2023 | $2,820 | $235,410 | $33,600 | $201,810 |
| 2022 | $2,390 | $198,860 | $35,000 | $163,860 |
| 2021 | $2,575 | $198,860 | $35,000 | $163,860 |
| 2020 | $2,301 | $198,860 | $35,000 | $163,860 |
| 2019 | $2,255 | $198,860 | $35,000 | $163,860 |
| 2018 | $2,030 | $181,150 | $32,000 | $149,150 |
| 2017 | $1,901 | $181,150 | $32,000 | $149,150 |
| 2013 | $1,812 | $181,150 | $32,000 | $149,150 |
Source: Public Records
Map
Nearby Homes
- 6102 Black Tie Ct
- 5901 Soverign Ct
- 6905 Waller Ln
- 7005 Feyhurst Dr
- 7226 Durst Dr
- 8421 Grandel Forest Way
- 7109 Uranus Dr
- 5214 Plume Dr
- 6711 Astral Dr
- 5707 Grandel Blvd
- 6917 Memory Ln
- 6100 Azalea Ln
- 6606 Lunar Dr
- 5220 Skylight Dr
- 7010 Memory Ln
- 5929 Dewitt Dr Unit 1001
- 6404 Terry Rd
- 5400 Galaxie Dr
- 7406 Ronan Dr
- 7716 Jonquil Dr
- 7233 Strive Ln
- 7235 Strive Ln
- 7235 Strive Ln Unit LOT 99
- 7231 Strive Ln
- 7231 Strive Ln Unit LOT 97
- 7229 Strive Ln
- 7229 Strive Ln Unit L 96
- 7237 Strive Ln
- 6008 Titanic Way
- 6006 Titanic Way
- 6010 Titanic Way
- 6010 Titanic Way Unit LOT 102
- 6004 Titanic Way
- 6004 Titanic Way Unit L 105
- 6004 Titanic Way Unit LOT 105
- 7227 Strive Ln
- 6012 Titanic Way
- 6012 Titanic Way Unit LOT 101
- 6012 Titanic Way Unit L 101
- 7236 Strive Ln