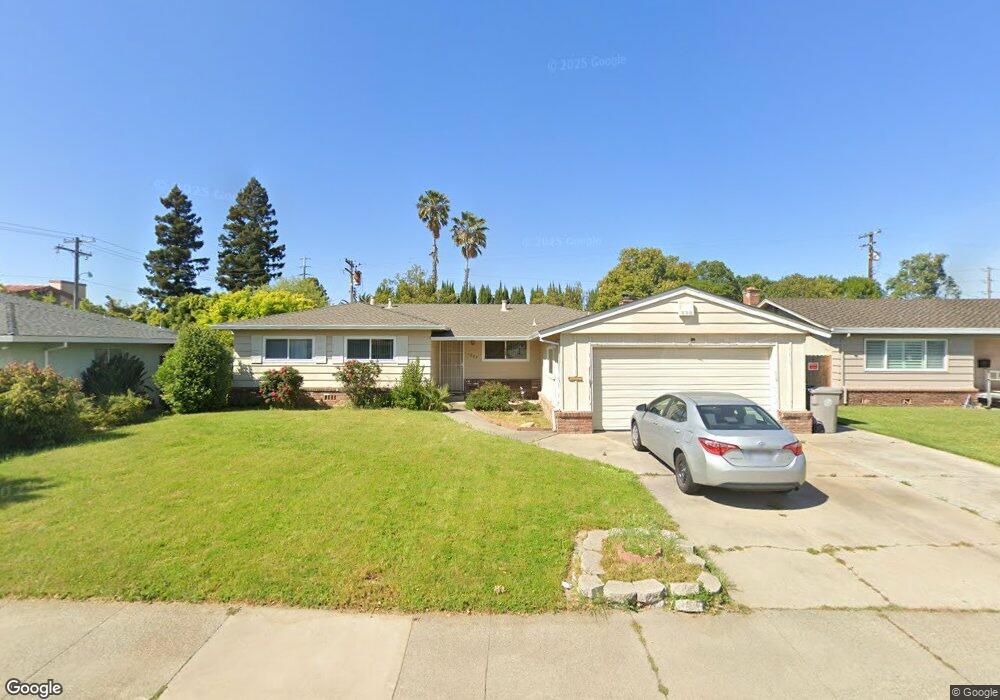
7239 Farm Dale Way Sacramento, CA 95831
South Land Park NeighborhoodEstimated Value: $361,000 - $589,000
3
Beds
2
Baths
1,458
Sq Ft
$343/Sq Ft
Est. Value
About This Home
This home is located at 7239 Farm Dale Way, Sacramento, CA 95831 and is currently estimated at $500,801, approximately $343 per square foot. 7239 Farm Dale Way is a home located in Sacramento County with nearby schools including Pony Express Elementary School, Sam Brannan Middle School, and John F. Kennedy High School.
Ownership History
Date
Name
Owned For
Owner Type
Purchase Details
Closed on
Oct 9, 2024
Sold by
Cresswell Robert E
Bought by
Cresswell Robert E
Current Estimated Value
Home Financials for this Owner
Home Financials are based on the most recent Mortgage that was taken out on this home.
Original Mortgage
$416,000
Outstanding Balance
$411,627
Interest Rate
6.35%
Mortgage Type
New Conventional
Estimated Equity
$89,174
Purchase Details
Closed on
Sep 14, 2001
Sold by
Yee Kristin S and Tsztoo Howard J
Bought by
Cresswell Robert E and Cresswell Tricia L
Home Financials for this Owner
Home Financials are based on the most recent Mortgage that was taken out on this home.
Original Mortgage
$169,520
Interest Rate
7%
Mortgage Type
FHA
Purchase Details
Closed on
Mar 22, 1994
Sold by
Taztoo Lauren D and Yee Lauren D
Bought by
Yee Kristin S and Taztoo Howard J
Create a Home Valuation Report for This Property
The Home Valuation Report is an in-depth analysis detailing your home's value as well as a comparison with similar homes in the area
Home Values in the Area
Average Home Value in this Area
Purchase History
| Date | Buyer | Sale Price | Title Company |
|---|---|---|---|
| Cresswell Robert E | -- | California Best Title | |
| Cresswell Robert E | $172,000 | Placer Title Company | |
| Yee Kristin S | -- | North American Title Co Inc |
Source: Public Records
Mortgage History
| Date | Status | Borrower | Loan Amount |
|---|---|---|---|
| Open | Cresswell Robert E | $416,000 | |
| Previous Owner | Yee Kristin S | $30,000 | |
| Previous Owner | Cresswell Robert E | $169,520 |
Source: Public Records
Tax History Compared to Growth
Tax History
| Year | Tax Paid | Tax Assessment Tax Assessment Total Assessment is a certain percentage of the fair market value that is determined by local assessors to be the total taxable value of land and additions on the property. | Land | Improvement |
|---|---|---|---|---|
| 2025 | $3,135 | $253,943 | $66,466 | $187,477 |
| 2024 | $3,135 | $248,964 | $65,163 | $183,801 |
| 2023 | $3,054 | $244,084 | $63,886 | $180,198 |
| 2022 | $3,015 | $239,299 | $62,634 | $176,665 |
| 2021 | $2,869 | $234,607 | $61,406 | $173,201 |
| 2020 | $2,884 | $232,203 | $60,777 | $171,426 |
| 2019 | $2,823 | $227,651 | $59,586 | $168,065 |
| 2018 | $2,749 | $223,188 | $58,418 | $164,770 |
| 2017 | $2,705 | $218,813 | $57,273 | $161,540 |
| 2016 | $2,644 | $214,523 | $56,150 | $158,373 |
| 2015 | $2,599 | $211,302 | $55,307 | $155,995 |
| 2014 | $2,538 | $207,164 | $54,224 | $152,940 |
Source: Public Records
Map
Nearby Homes
- 7048 13th St
- 1312 58th Ave
- 7036 13th St
- 7332 Idle Wild Way
- 7341 Stanwood Way
- 1213 58th Ave
- 6877 Buena Terra Way
- 1449 64th Ave
- 1100 La Fleur Way
- 7170 Westmoreland Way
- 1416 Lomas Way
- 7110 Westmoreland Way
- 1053 L Aloutte Way
- 7284 Cromwell Way
- 14 Morningsun Ct
- 1210 Cedar Tree Way
- 7518 Bowen Cir
- 1716 68th Ave
- 1 Sandpointe Ct
- 6650 Belleau Wood Ln
- 7235 Farm Dale Way
- 7243 Farm Dale Way
- 7247 Farm Dale Way
- 7234 Farm Dale Way
- 7251 Farm Dale Way
- 7244 Camino Del Rey St
- 7248 Farm Dale Way
- 7255 Farm Dale Way
- 7252 Farm Dale Way
- 7245 Camino Del Rey St
- 7248 Camino Del Rey St
- 7263 S Land Park Dr
- 7261 Stanwood Way
- 7260 Farm Dale Way
- 7259 Farm Dale Way
- 7252 Camino Del Rey St
- 7265 Stanwood Way
- 7267 S Land Park Dr
- 7256 S Land Park Dr