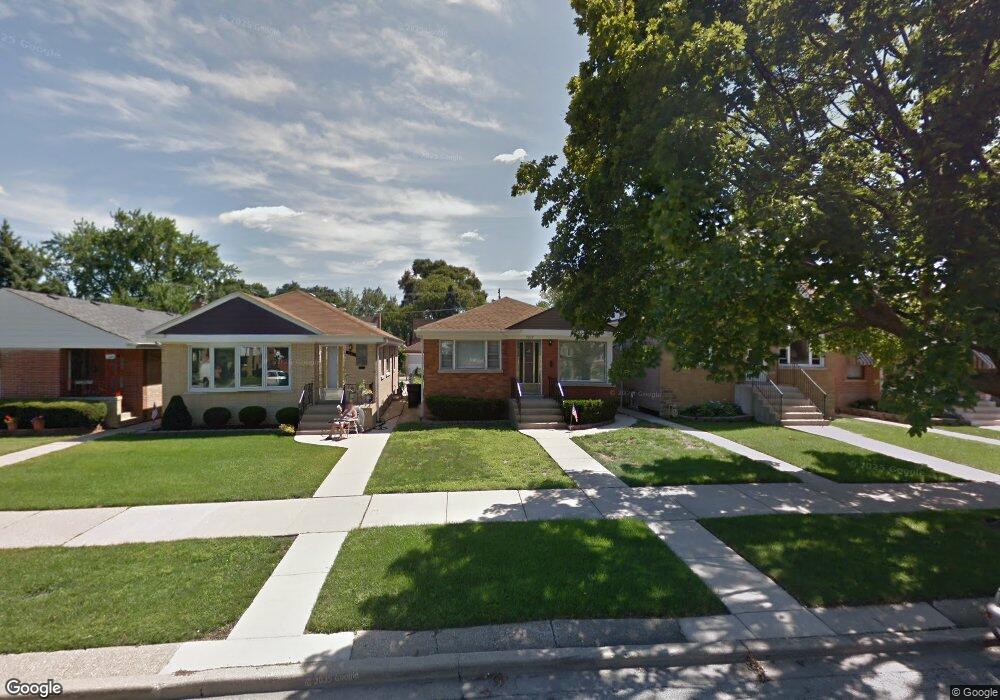
7239 N Osceola Ave Chicago, IL 60631
Edison Park NeighborhoodEstimated Value: $353,000 - $412,000
2
Beds
1
Bath
1,022
Sq Ft
$374/Sq Ft
Est. Value
About This Home
This home is located at 7239 N Osceola Ave, Chicago, IL 60631 and is currently estimated at $382,572, approximately $374 per square foot. 7239 N Osceola Ave is a home located in Cook County with nearby schools including Ebinger Elementary School, William Howard Taft High School, and St. Juliana School.
Ownership History
Date
Name
Owned For
Owner Type
Purchase Details
Closed on
Dec 4, 2024
Sold by
Peter Heneghan Trust and Heneghan Peter T
Bought by
Salus Maxwell C
Current Estimated Value
Home Financials for this Owner
Home Financials are based on the most recent Mortgage that was taken out on this home.
Original Mortgage
$272,000
Outstanding Balance
$269,738
Interest Rate
6.5%
Mortgage Type
New Conventional
Estimated Equity
$112,834
Purchase Details
Closed on
May 11, 2017
Sold by
Heneghan Peter
Bought by
Peter Heneghan Trust
Create a Home Valuation Report for This Property
The Home Valuation Report is an in-depth analysis detailing your home's value as well as a comparison with similar homes in the area
Home Values in the Area
Average Home Value in this Area
Purchase History
| Date | Buyer | Sale Price | Title Company |
|---|---|---|---|
| Salus Maxwell C | $340,000 | Executive Land Title | |
| Peter Heneghan Trust | -- | None Available |
Source: Public Records
Mortgage History
| Date | Status | Borrower | Loan Amount |
|---|---|---|---|
| Open | Salus Maxwell C | $272,000 |
Source: Public Records
Tax History Compared to Growth
Tax History
| Year | Tax Paid | Tax Assessment Tax Assessment Total Assessment is a certain percentage of the fair market value that is determined by local assessors to be the total taxable value of land and additions on the property. | Land | Improvement |
|---|---|---|---|---|
| 2024 | $5,093 | $29,850 | $9,375 | $20,475 |
| 2023 | $4,926 | $30,107 | $7,500 | $22,607 |
| 2022 | $4,926 | $30,107 | $7,500 | $22,607 |
| 2021 | $4,849 | $30,107 | $7,500 | $22,607 |
| 2020 | $4,336 | $25,048 | $5,062 | $19,986 |
| 2019 | $4,290 | $27,526 | $5,062 | $22,464 |
| 2018 | $4,591 | $29,427 | $5,062 | $24,365 |
| 2017 | $3,819 | $23,816 | $4,500 | $19,316 |
| 2016 | $3,913 | $23,816 | $4,500 | $19,316 |
| 2015 | $4,097 | $26,857 | $4,500 | $22,357 |
| 2014 | $3,218 | $21,747 | $3,750 | $17,997 |
| 2013 | $3,135 | $21,747 | $3,750 | $17,997 |
Source: Public Records
Map
Nearby Homes
- 7314 N Odell Ave
- 7215 N Olcott Ave
- 7357 N Oketo Ave
- 7255 N Oriole Ave
- 7422 N Olcott Ave
- 7433 N Octavia Ave
- 7441 N Oriole Ave
- 7005 N Osceola Ave
- 7101 N Ottawa Ave
- 7324 W Lunt Ave
- 7404 N Overhill Ave
- 7039 N Ottawa Ave
- 7315 W Lunt Ave
- 7525 N Overhill Ave Unit 206
- 7091 W Touhy Ave Unit 505
- 240 E Sibley St
- 7061 W Touhy Ave Unit 307
- 7061 W Touhy Ave Unit 502
- 7450 N Waukegan Rd Unit 509
- 7450 N Waukegan Rd Unit 206
- 7237 N Osceola Ave
- 7241 N Osceola Ave
- 7233 N Osceola Ave
- 7245 N Osceola Ave
- 7247 N Osceola Ave
- 7229 N Osceola Ave
- 7249 N Osceola Ave
- 7238 N Oketo Ave
- 7244 N Oketo Ave
- 7253 N Osceola Ave
- 7248 N Oketo Ave
- 7257 N Osceola Ave
- 7238 N Osceola Ave
- 7242 N Osceola Ave
- 7236 N Osceola Ave
- 7250 N Oketo Ave
- 7244 N Osceola Ave
- 7232 N Osceola Ave
- 7248 N Osceola Ave
- 7250 N Osceola Ave