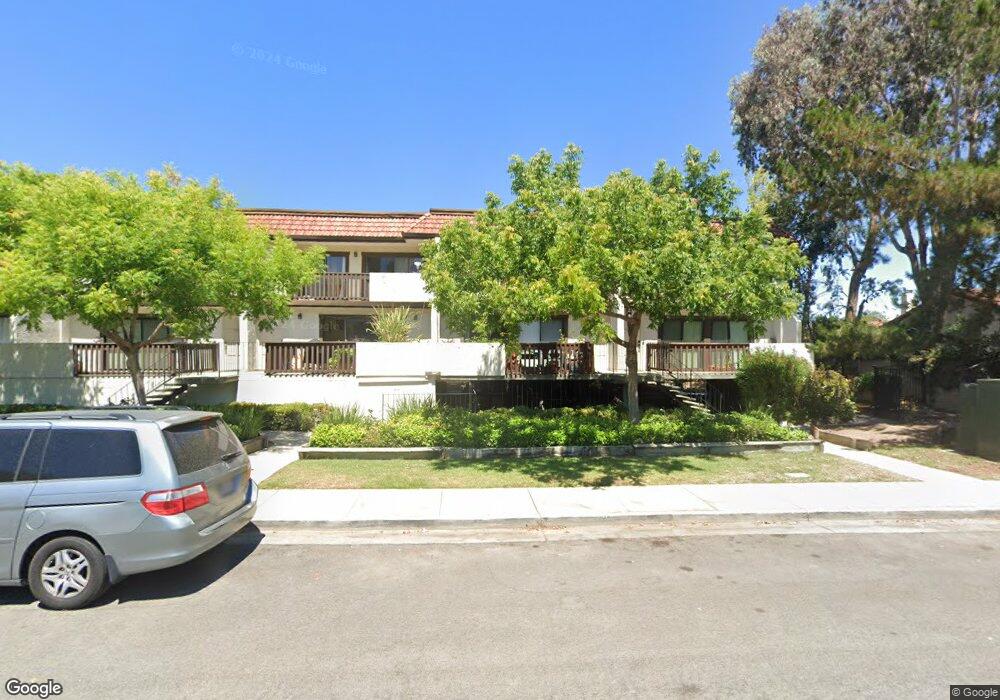
7239 Via Vico Unit 21 San Jose, CA 95129
Calabazas NeighborhoodEstimated Value: $850,000 - $1,215,000
2
Beds
1
Bath
1,024
Sq Ft
$955/Sq Ft
Est. Value
About This Home
This home is located at 7239 Via Vico Unit 21, San Jose, CA 95129 and is currently estimated at $977,416, approximately $954 per square foot. 7239 Via Vico Unit 21 is a home located in Santa Clara County with nearby schools including Nelson S. Dilworth Elementary School, Joaquin Miller Middle, and Lynbrook High School.
Ownership History
Date
Name
Owned For
Owner Type
Purchase Details
Closed on
Mar 22, 2010
Sold by
Chen Shaun H and Chen Liping W
Bought by
Chen Shaun H and Chen Liping W
Current Estimated Value
Home Financials for this Owner
Home Financials are based on the most recent Mortgage that was taken out on this home.
Original Mortgage
$275,300
Outstanding Balance
$182,098
Interest Rate
4.94%
Mortgage Type
New Conventional
Estimated Equity
$795,318
Purchase Details
Closed on
May 27, 2006
Sold by
Chen Shaun H and Chen Liping W
Bought by
Chen Shaun H and Chen Liping W
Purchase Details
Closed on
Sep 12, 2005
Sold by
Weygandt Lotus Lin and Weygandt Jonathan Birchard
Bought by
Chen Shaun H and Chen Liping W
Home Financials for this Owner
Home Financials are based on the most recent Mortgage that was taken out on this home.
Original Mortgage
$285,000
Interest Rate
6.25%
Mortgage Type
New Conventional
Create a Home Valuation Report for This Property
The Home Valuation Report is an in-depth analysis detailing your home's value as well as a comparison with similar homes in the area
Home Values in the Area
Average Home Value in this Area
Purchase History
| Date | Buyer | Sale Price | Title Company |
|---|---|---|---|
| Chen Shaun H | -- | Placer Title Company | |
| Chen Shaun H | -- | None Available | |
| Chen Shaun H | $485,000 | Chicago Title |
Source: Public Records
Mortgage History
| Date | Status | Borrower | Loan Amount |
|---|---|---|---|
| Open | Chen Shaun H | $275,300 | |
| Closed | Chen Shaun H | $285,000 |
Source: Public Records
Tax History Compared to Growth
Tax History
| Year | Tax Paid | Tax Assessment Tax Assessment Total Assessment is a certain percentage of the fair market value that is determined by local assessors to be the total taxable value of land and additions on the property. | Land | Improvement |
|---|---|---|---|---|
| 2025 | $8,271 | $662,775 | $265,109 | $397,666 |
| 2024 | $8,271 | $649,780 | $259,911 | $389,869 |
| 2023 | $8,186 | $637,040 | $254,815 | $382,225 |
| 2022 | $8,295 | $624,550 | $249,819 | $374,731 |
| 2021 | $8,200 | $612,305 | $244,921 | $367,384 |
| 2020 | $8,094 | $606,027 | $242,410 | $363,617 |
| 2019 | $7,947 | $594,145 | $237,657 | $356,488 |
| 2018 | $7,736 | $582,497 | $232,998 | $349,499 |
| 2017 | $7,707 | $571,077 | $228,430 | $342,647 |
| 2016 | $7,477 | $559,880 | $223,951 | $335,929 |
| 2015 | $7,430 | $551,472 | $220,588 | $330,884 |
| 2014 | $7,220 | $540,670 | $216,267 | $324,403 |
Source: Public Records
Map
Nearby Homes
- 7433 Rollingdell Dr
- 7438 Stanford Place
- 00 Cleo Ave
- 1122 Scotland Dr
- 7344 Rainbow Dr
- 7130 Rainbow Dr Unit 2
- 7150 Rainbow Dr Unit 42
- 1040 W Riverside Way
- 11510 Bianchini Ln
- 6757 Devonshire Dr
- 6944 Chantel Ct
- 10581 Whitney Way
- 6893 Chantel Ct
- 6886 Chantel Ct
- 1258 S Stelling Rd
- 20882 Cherryland Dr
- 1270 S Stelling Rd
- 902 Sage Ct
- 1083 Miller Ave
- 1017 Craig Dr