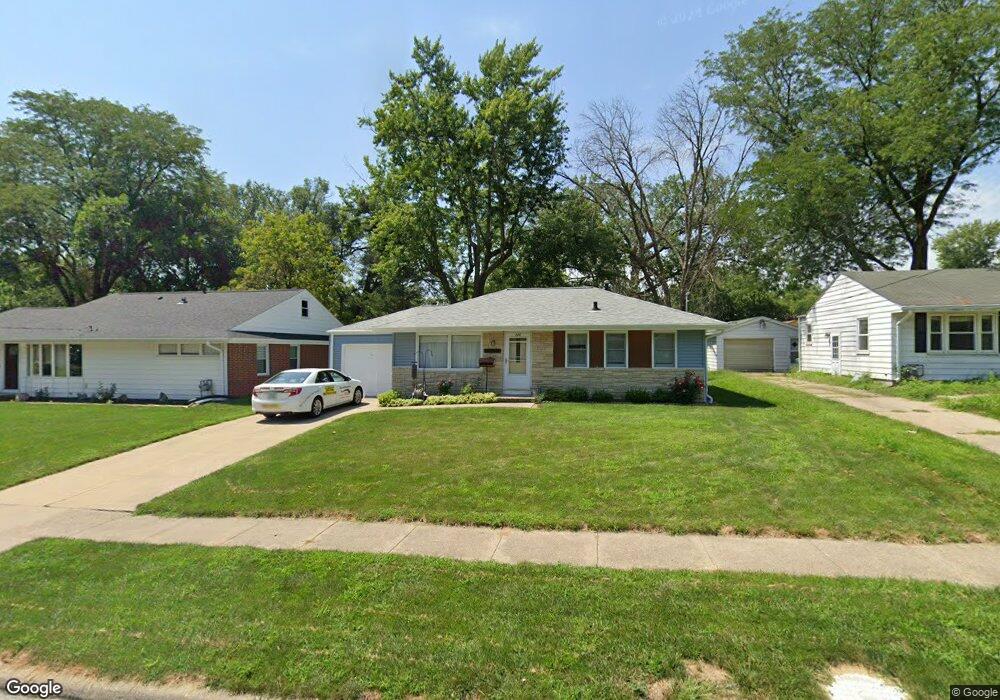
724 20th St West Des Moines, IA 50265
Estimated Value: $233,761 - $252,000
3
Beds
1
Bath
886
Sq Ft
$273/Sq Ft
Est. Value
About This Home
This home is located at 724 20th St, West Des Moines, IA 50265 and is currently estimated at $241,440, approximately $272 per square foot. 724 20th St is a home located in Polk County with nearby schools including Fairmeadows Elementary School, Stilwell Junior High School, and Valley Southwoods Freshman High School.
Ownership History
Date
Name
Owned For
Owner Type
Purchase Details
Closed on
Oct 26, 2018
Sold by
Jones Donna L and Jones Edward Mishmash
Bought by
Jones Donna L and Jones Neil C
Current Estimated Value
Purchase Details
Closed on
Feb 22, 2016
Sold by
Jones Donna L and Edward Mishmash H
Bought by
Jones Donna L and Edward Mishmash H
Purchase Details
Closed on
Jul 6, 2011
Sold by
Mishmash Polly
Bought by
Mishmash Polly and Jones Donna L
Create a Home Valuation Report for This Property
The Home Valuation Report is an in-depth analysis detailing your home's value as well as a comparison with similar homes in the area
Home Values in the Area
Average Home Value in this Area
Purchase History
| Date | Buyer | Sale Price | Title Company |
|---|---|---|---|
| Jones Donna L | -- | None Available | |
| Jones Donna L | -- | None Available | |
| Mishmash Polly | -- | None Available |
Source: Public Records
Tax History Compared to Growth
Tax History
| Year | Tax Paid | Tax Assessment Tax Assessment Total Assessment is a certain percentage of the fair market value that is determined by local assessors to be the total taxable value of land and additions on the property. | Land | Improvement |
|---|---|---|---|---|
| 2025 | $2,972 | $212,700 | $71,300 | $141,400 |
| 2024 | $2,972 | $187,500 | $62,100 | $125,400 |
| 2023 | $3,012 | $187,500 | $62,100 | $125,400 |
| 2022 | $2,976 | $156,000 | $52,600 | $103,400 |
| 2021 | $2,964 | $156,000 | $52,600 | $103,400 |
| 2020 | $2,920 | $147,800 | $49,700 | $98,100 |
| 2019 | $2,698 | $147,800 | $49,700 | $98,100 |
| 2018 | $2,704 | $131,700 | $43,500 | $88,200 |
| 2017 | $2,538 | $131,700 | $43,500 | $88,200 |
| 2016 | $2,234 | $120,100 | $39,100 | $81,000 |
| 2015 | $2,234 | $120,100 | $39,100 | $81,000 |
| 2014 | $2,282 | $121,100 | $38,800 | $82,300 |
Source: Public Records
Map
Nearby Homes
- 725 20th St
- 720 19th St
- 1909 Prospect Ave
- 1829 Pearl Dr
- 2009 Vine St
- 2100 Meadow Brook Dr Unit 103
- 1809 Pearl Dr
- 1829 Locust St
- 842 23rd St
- 1916 Locust St
- 2013 Crown Flair Dr
- 2412 Fairlawn Dr
- 417 18th Place
- 2509 Fairlawn Dr
- 2021 Elm Cir
- 2300 Locust St
- 1006 22nd St
- 262 23rd St
- 2006 Maple Cir
- 2002 Maple Cir