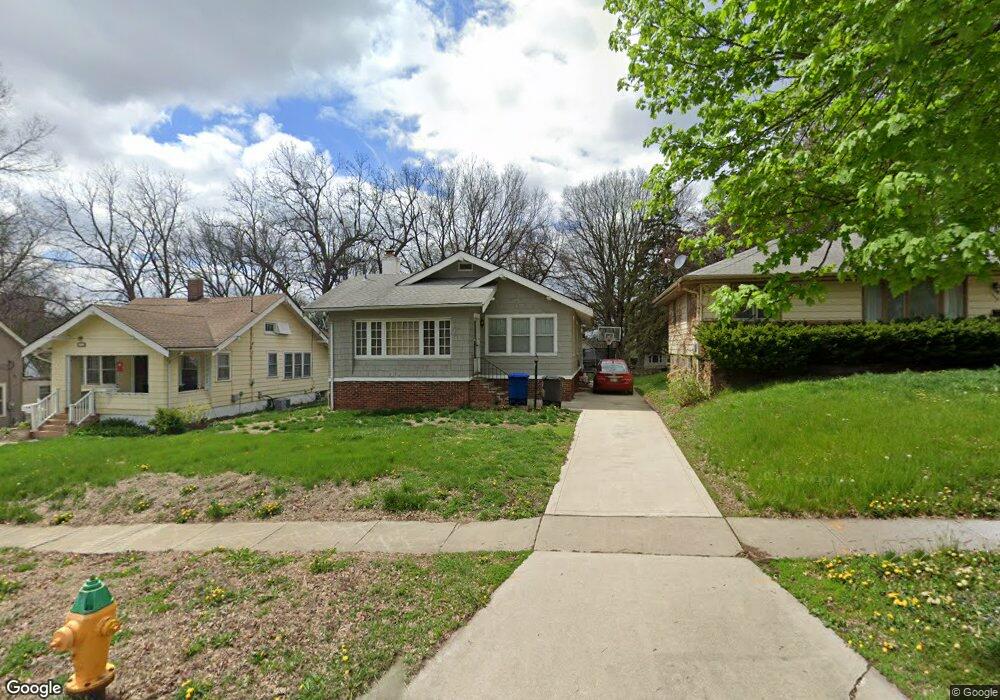
724 39th St Des Moines, IA 50312
North of Grand NeighborhoodEstimated Value: $188,000 - $227,000
2
Beds
1
Bath
1,026
Sq Ft
$202/Sq Ft
Est. Value
About This Home
This home is located at 724 39th St, Des Moines, IA 50312 and is currently estimated at $207,141, approximately $201 per square foot. 724 39th St is a home located in Polk County with nearby schools including Hubbell Elementary, Roosevelt High School, and St Augustin Catholic School.
Ownership History
Date
Name
Owned For
Owner Type
Purchase Details
Closed on
Mar 29, 2005
Sold by
Mauss Jean M
Bought by
Rafert Samara and Gearino Dan
Current Estimated Value
Home Financials for this Owner
Home Financials are based on the most recent Mortgage that was taken out on this home.
Original Mortgage
$104,720
Outstanding Balance
$53,196
Interest Rate
5.64%
Mortgage Type
Fannie Mae Freddie Mac
Estimated Equity
$153,945
Purchase Details
Closed on
Mar 26, 2001
Sold by
Barnes John R
Bought by
Mauss Jean M
Home Financials for this Owner
Home Financials are based on the most recent Mortgage that was taken out on this home.
Original Mortgage
$91,550
Interest Rate
7.02%
Purchase Details
Closed on
Dec 18, 1999
Sold by
Mills John W and Mills Fielda L
Bought by
Barnes John R
Home Financials for this Owner
Home Financials are based on the most recent Mortgage that was taken out on this home.
Original Mortgage
$80,400
Interest Rate
7.7%
Create a Home Valuation Report for This Property
The Home Valuation Report is an in-depth analysis detailing your home's value as well as a comparison with similar homes in the area
Home Values in the Area
Average Home Value in this Area
Purchase History
| Date | Buyer | Sale Price | Title Company |
|---|---|---|---|
| Rafert Samara | $130,500 | -- | |
| Mauss Jean M | $94,000 | -- | |
| Barnes John R | $82,500 | -- |
Source: Public Records
Mortgage History
| Date | Status | Borrower | Loan Amount |
|---|---|---|---|
| Open | Rafert Samara | $104,720 | |
| Previous Owner | Mauss Jean M | $91,550 | |
| Previous Owner | Barnes John R | $80,400 |
Source: Public Records
Tax History Compared to Growth
Tax History
| Year | Tax Paid | Tax Assessment Tax Assessment Total Assessment is a certain percentage of the fair market value that is determined by local assessors to be the total taxable value of land and additions on the property. | Land | Improvement |
|---|---|---|---|---|
| 2025 | $3,422 | $194,500 | $49,700 | $144,800 |
| 2024 | $3,422 | $173,900 | $44,200 | $129,700 |
| 2023 | $3,754 | $173,900 | $44,200 | $129,700 |
| 2022 | $3,726 | $159,300 | $41,900 | $117,400 |
| 2021 | $3,406 | $159,300 | $41,900 | $117,400 |
| 2020 | $3,534 | $145,100 | $38,300 | $106,800 |
| 2019 | $3,154 | $145,100 | $38,300 | $106,800 |
| 2018 | $3,118 | $125,900 | $33,100 | $92,800 |
| 2017 | $2,786 | $125,900 | $33,100 | $92,800 |
| 2016 | $2,708 | $111,500 | $29,100 | $82,400 |
| 2015 | $2,708 | $111,500 | $29,100 | $82,400 |
| 2014 | $2,480 | $105,800 | $27,600 | $78,200 |
Source: Public Records
Map
Nearby Homes