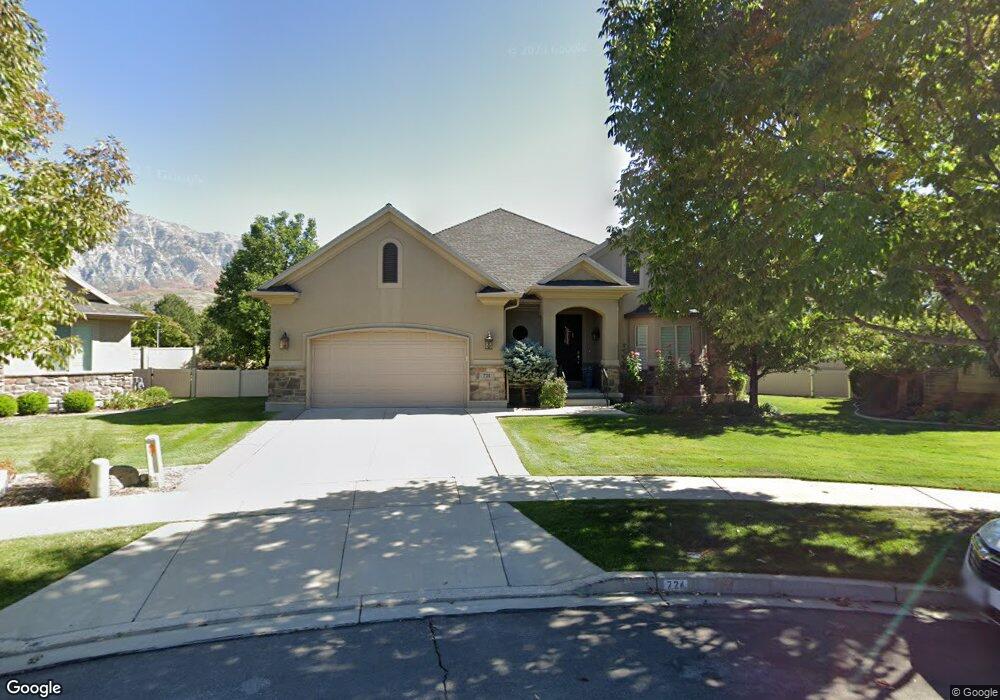
724 E 1220 N Orem, UT 84097
Windsor NeighborhoodEstimated Value: $813,000 - $962,000
4
Beds
3
Baths
4,333
Sq Ft
$205/Sq Ft
Est. Value
About This Home
This home is located at 724 E 1220 N, Orem, UT 84097 and is currently estimated at $889,197, approximately $205 per square foot. 724 E 1220 N is a home located in Utah County with nearby schools including Orchard Elementary School, Canyon View Junior High School, and Timpanogos High School.
Ownership History
Date
Name
Owned For
Owner Type
Purchase Details
Closed on
Jun 20, 2024
Sold by
Anna M Bates Revocable Trust and Bates Steven Anders
Bought by
Gerald N Lund And Lynn S Lund Family Living T and Lund
Current Estimated Value
Purchase Details
Closed on
Aug 6, 2014
Sold by
Bates Anna
Bought by
Bates Anna M and The Anna M Bates Revocable Trust
Purchase Details
Closed on
Apr 16, 2007
Sold by
Ivory Homes Ltd
Bought by
Bates Vane and Bates Anna
Create a Home Valuation Report for This Property
The Home Valuation Report is an in-depth analysis detailing your home's value as well as a comparison with similar homes in the area
Home Values in the Area
Average Home Value in this Area
Purchase History
| Date | Buyer | Sale Price | Title Company |
|---|---|---|---|
| Gerald N Lund And Lynn S Lund Family Living T | -- | Cottonwood Title | |
| Bates Anna M | -- | None Available | |
| Bates Vane | -- | Cottonwood Title Insurance | |
| Ivory Homes Ltd | -- | Cottonwood Title Insurance |
Source: Public Records
Tax History
| Year | Tax Paid | Tax Assessment Tax Assessment Total Assessment is a certain percentage of the fair market value that is determined by local assessors to be the total taxable value of land and additions on the property. | Land | Improvement |
|---|---|---|---|---|
| 2025 | $3,070 | $433,565 | -- | -- |
| 2024 | $3,070 | $375,430 | $0 | $0 |
| 2023 | $2,982 | $391,875 | $0 | $0 |
| 2022 | $3,210 | $408,650 | $0 | $0 |
| 2021 | $2,917 | $562,500 | $191,200 | $371,300 |
| 2020 | $2,743 | $519,900 | $166,300 | $353,600 |
| 2019 | $2,619 | $516,100 | $166,300 | $349,800 |
| 2018 | $2,498 | $470,500 | $166,300 | $304,200 |
| 2017 | $2,266 | $228,580 | $0 | $0 |
| 2016 | $2,368 | $220,275 | $0 | $0 |
| 2015 | $2,457 | $216,150 | $0 | $0 |
| 2014 | $2,344 | $205,260 | $0 | $0 |
Source: Public Records
Map
Nearby Homes
- 710 E 1280 N
- 1324 N 750 E Unit 3
- 733 E 1450 N Unit 5
- 713 E 1450 N Unit 23
- 1356 N 750 E Unit 11
- 1366 N 750 E
- 747 E 1500 N Unit 13
- 713 E 1500 St N Unit 19
- 723 E 1450 N Unit 25
- 976 N 560 E
- 1643 N Mountain Oaks Dr
- 372 E 1165 N
- 1480 N 430 E
- 1371 N 330 E Unit 8
- 540 E Quail Rd
- 363 E 1395 N Unit 22
- 471 E 700 N
- 362 E 800 N Unit 1
- 695 E 1870 N
- 917 N Garden Dr
Your Personal Tour Guide
Ask me questions while you tour the home.