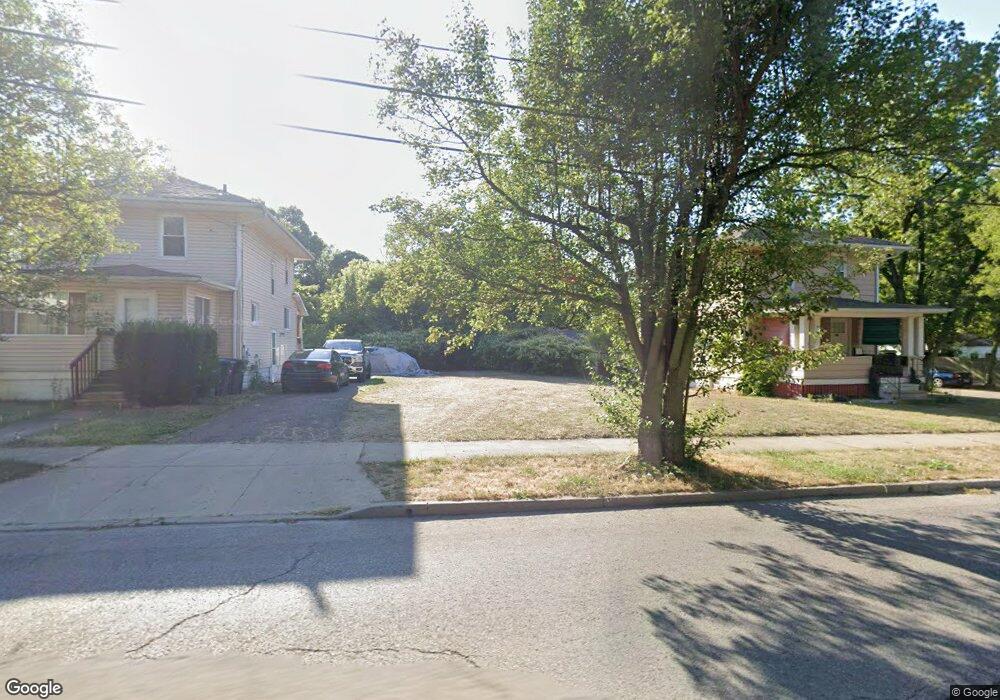
724 Inman St Akron, OH 44306
East Akron NeighborhoodEstimated Value: $77,000
2
Beds
1
Bath
1,278
Sq Ft
$60/Sq Ft
Est. Value
About This Home
This home is located at 724 Inman St, Akron, OH 44306 and is currently estimated at $77,000, approximately $60 per square foot. 724 Inman St is a home located in Summit County with nearby schools including Glover Community Learning Center, Kenmore Garfield Community Learning Center, and Main Preparatory Academy.
Ownership History
Date
Name
Owned For
Owner Type
Purchase Details
Closed on
Apr 8, 2024
Sold by
Summit Cnty Land Reutilization
Bought by
Mossybirch Investments Llc
Current Estimated Value
Purchase Details
Closed on
Apr 4, 2024
Sold by
Summit Cnty Land Reutilization
Bought by
Mossybirch Investments Llc
Purchase Details
Closed on
Aug 9, 2017
Sold by
Peterson Mary and Peterson Mary
Bought by
The Summit County Land Reutiliztion Corp
Create a Home Valuation Report for This Property
The Home Valuation Report is an in-depth analysis detailing your home's value as well as a comparison with similar homes in the area
Home Values in the Area
Average Home Value in this Area
Purchase History
| Date | Buyer | Sale Price | Title Company |
|---|---|---|---|
| Mossybirch Investments Llc | -- | None Listed On Document | |
| Mossybirch Investments Llc | -- | None Listed On Document | |
| The Summit County Land Reutiliztion Corp | -- | None Available |
Source: Public Records
Tax History Compared to Growth
Tax History
| Year | Tax Paid | Tax Assessment Tax Assessment Total Assessment is a certain percentage of the fair market value that is determined by local assessors to be the total taxable value of land and additions on the property. | Land | Improvement |
|---|---|---|---|---|
| 2025 | $76 | $3,500 | $3,500 | -- |
| 2024 | $76 | $3,500 | $3,500 | -- |
| 2023 | $76 | $3,500 | $3,500 | $0 |
| 2022 | $76 | $2,058 | $2,058 | $0 |
| 2021 | $76 | $2,058 | $2,058 | $0 |
| 2020 | $76 | $2,060 | $2,060 | $0 |
| 2019 | $76 | $2,910 | $2,910 | $0 |
| 2018 | $76 | $2,910 | $2,910 | $0 |
| 2017 | $1,884 | $8,530 | $2,910 | $5,620 |
| 2016 | $2,792 | $10,570 | $3,480 | $7,090 |
| 2015 | $1,884 | $11,080 | $3,480 | $7,600 |
| 2014 | $1,280 | $11,080 | $3,480 | $7,600 |
| 2013 | $1,599 | $14,370 | $3,480 | $10,890 |
Source: Public Records
Map
Nearby Homes
- 696 Inman St
- 720 E Crosier St
- 836 5th Ave
- 823 Merton Ave
- 939 E Crosier St
- 548 Winans Ave
- 522 Winans Ave
- 495 Elbon Ave
- 920 Rowe St
- 694 Virginia Ave
- 970 Allendale Ave
- 546 Baird St
- 877 Bertha Ave
- 542 Baird St
- 979 Neptune Ave
- 1043 Coventry St
- 724 Virginia Ave
- 713 Virginia Ave
- 622 Talbot Ave
- 717 Virginia Ave